. 2019 Jul;25(7):768-782.
doi: 10.1261/rna.069211.118. Epub 2019 Apr 19.

Antagonism between the RNA-binding protein Musashi1 and miR-137 and its potential impact on neurogenesis and glioblastoma development

Affiliations

Antagonism between the RNA-binding protein Musashi1 and miR-137 and its potential impact on neurogenesis and glioblastoma development

Mitzli X Velasco et al. RNA. 2019 Jul.

Abstract

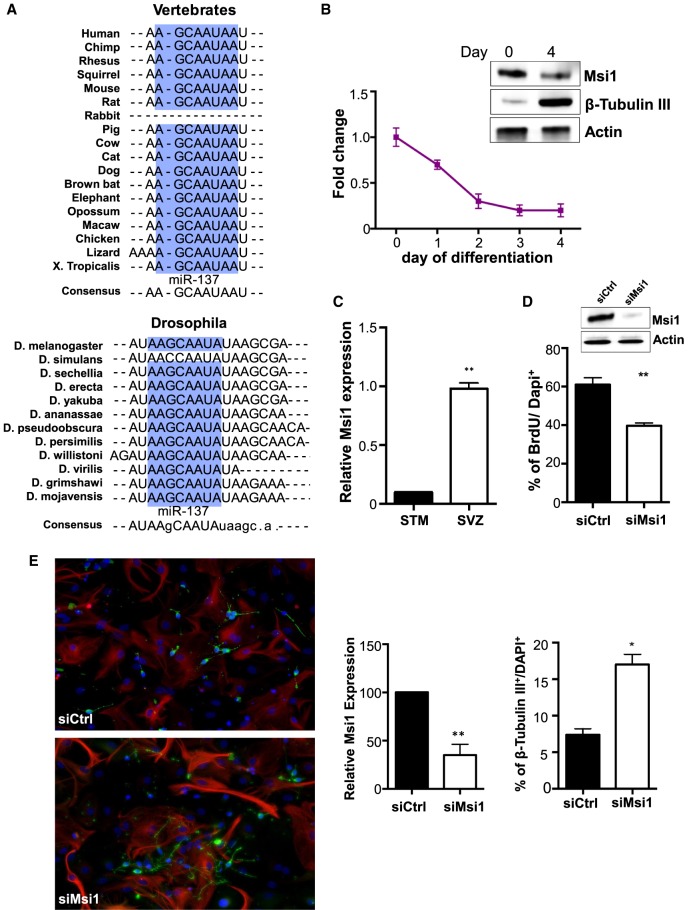
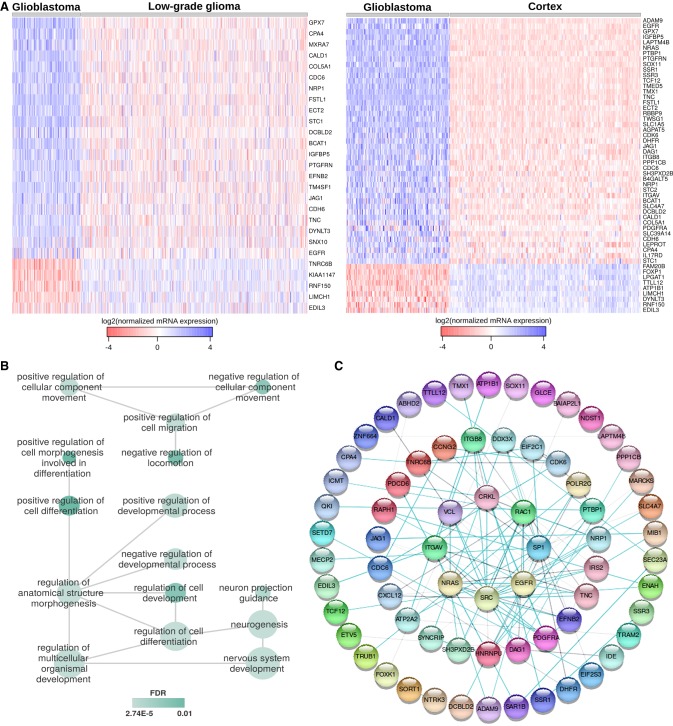
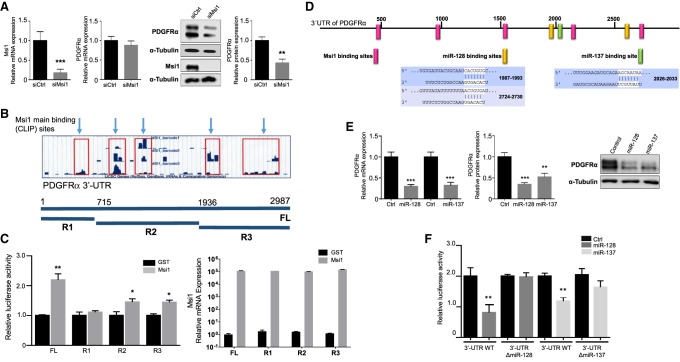
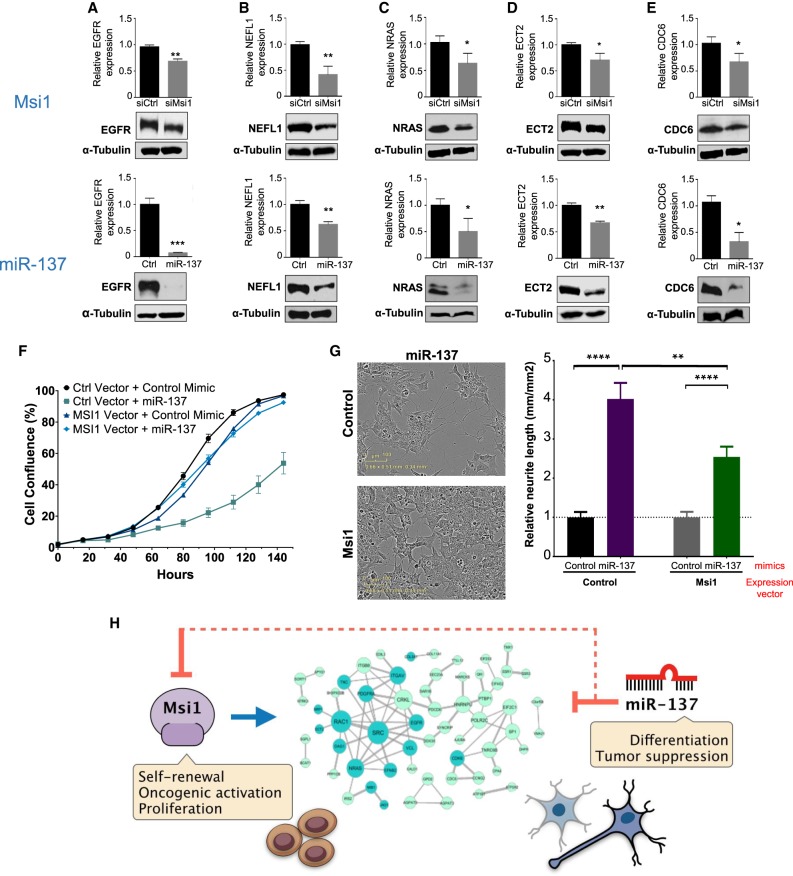
RNA-binding proteins (RBPs) and miRNAs are critical gene expression regulators that interact with one another in cooperative and antagonistic fashions. We identified Musashi1 (Msi1) and miR-137 as regulators of a molecular switch between self-renewal and differentiation. Msi1 and miR-137 have opposite expression patterns and functions, and Msi1 is repressed by miR-137. Msi1 is a stem-cell protein implicated in self-renewal while miR-137 functions as a proneuronal differentiation miRNA. In gliomas, miR-137 functions as a tumor suppressor while Msi1 is a prooncogenic factor. We suggest that the balance between Msi1 and miR-137 is a key determinant in cell fate decisions and disruption of this balance could contribute to neurodegenerative diseases and glioma development. Genomic analyses revealed that Msi1 and miR-137 share 141 target genes associated with differentiation, development, and morphogenesis. Initial results pointed out that these two regulators have an opposite impact on the expression of their target genes. Therefore, we propose an antagonistic model in which this network of shared targets could be either repressed by miR-137 or activated by Msi1, leading to different outcomes (self-renewal, proliferation, tumorigenesis).

Keywords: Musashi1; RNA-binding protein; glioblastoma; miR-137; miRNA; neurogenesis.


Figures

FIGURE 1.
FIGURE 1.
Musashi1's role in neurogenesis. (A) TargetScan predictions show that miR-137 binding site in Msi1's 3′-UTR is conserved among vertebrates and in the Drosophila genus. Highly conserved nucleotides are shown in blue boxes. (B) Msi1 mRNA expression decreases during NSC differentiation in vitro (left panel). Western blot analysis shows that Msi1 protein levels are higher in NSCs in comparison to differentiated cells. β-Tubulin III was used as a neuronal marker (right panel). (C) Msi1 expression is higher in cells located in subventricular zone (SVZ) in comparison to the cells in the striatum (STM). (D) Western analysis shows effective siRNA knockdown of Msi1 in NSCs, siMsi1 versus siCtrl (top panel). Quantification of the percentage of NSCs that incorporated BrdU following transfection with siMsi1 and siRNA control (bottom panel). (E) NSCs were transfected with siMsi1 or siControl and then transferred to differentiation media. Cells were immunostained with β-Tubulin III (red) 4 d later (left panel). Nuclei were stained with DAPI1 (blue). qRT-PCR analysis showing Msi1 knockdown levels obtained in NSCs (panel in the middle). Quantification of neurons 4 d after transfer to differentiation media (right panel). Experiment was performed using biological triplicates. The data are showed as mean ± standard deviation. (*) P-value > 0.05, (**) P < 0.001, (***) P < 0.0001.
FIGURE 2.
FIGURE 2.
Msi1 and miR-137 shared targets are associated with neurogenesis and gliomagenesis. (A) Heatmap showing the expression of miR-137/Msi1 shared targets in GBM versus LGG samples from the TCGA data repository and GBM versus healthy (frontal) cortex samples from GTEx. We show only the genes with consistent expression values across sample sets. (B) Gene Ontology (GO) analysis (biological process) of Msi1/miR-137 shared targets. Associations between most relevant GO terms according to REVIGO (Supek et al. 2011). (C) Predicted protein network according to STRING (Szklarczyk et al. 2015) showing the associations between Msi1/miR-137 common targets.
FIGURE 3.
FIGURE 3.
PDGFRα is regulated by Msi1, miR-128, and miR-137. (A) U251 cells were transfected with siCtrl or siMsi1 for 72 h. Msi1 (left panel) and PDGFRα (middle panel) mRNA expression levels were determined by qRT-PCR. Protein levels of Msi1 and PDGFRα were evaluated by western blot, using α-Tubulin as loading control (right panel). Experiment was performed with biological and technical triplicates. (B) UCSC Genome Browser plots of three experimental replicas of Msi1 iCLIP analysis. Light blue arrows show Msi1 binding sites (iCLIP sites) in the 3′-UTR of PDGFRα. In the middle section, we show a diagram representing the inserts cloned into a luciferase reporter; full-length (FL) contains the entire 3′-UTR of PDGFRα, R1 (from nucleotides 1 to 715), R2 (from nucleotides 716 to 1936), and R3 (from nucleotides 1937 to 2987). (C) Results of luciferase assays. Cells were transfected with combinations of the luciferase reporter constructs shown in B and Msi1 or GST expressing vectors. Figure on the right shows Msi1 expression levels measured by qRT-PCR in each transfection. Experiment was performed with biological and technical triplicates. (D) Diagram shows predicted miR-128 and miR-137 binding sites in the 3′-UTR of PDGFRα according to TargetScan and main Msi1 binding sites identified by CLIP. Base pair interactions between the mRNA and the miRNA seed region are displayed as vertical lines. (E) PDGFRα mRNA levels measured by qRT-PCR of U251 cells transfected with miRNA mimics (control, miR-128, or miR-137) (left panel). Western blot analysis of PDGFRα levels in U251 cells transfected with miRNA mimics (control, miR-128, or miR-137). α-Tubulin was using like a loading control. The two PDGFRα bands detected in all western blots are likely due to differences in glycosylation (Ip et al. 2018). (F) Regulation of PDGFRα by miR-128 and miR-137 was validated using luciferase assays. Three luciferase constructs were used. The first one contains the wild-type sequence of PDGFRα 3′-UTR. In the other two, the predicted binding motifs for miR-137 or miR-128 were deleted. Experiment was performed with biological and technical triplicates. Data was analyzed with Student's t-test and are presented as the mean ± deviation standard. (*) P < 0.05, (**) P < 0.001, (***) P < 0.0001.
FIGURE 4.
FIGURE 4.
Msi1 and miR-137 have opposite regulatory effects on the expression of shared target genes. (AE) Western blot analysis showing EGFR, NEFL1, NRAS, ECT2, and CDC6 expression in U251 cells transfected with Msi1 siRNA (siMsi1) or control siRNA (upper panel) and miR-137 or control mimics (Ctrl) (bottom panel). α-Tubulin was included as a loading control. (F) Graph shows proliferation curves obtained with the IncuCyte live imaging system of U251 cells transfected/infected with control mimics and control vector, miR-137 mimics and control vector, miR-137 mimics and Msi1 expressing vector. Experiment was performed using biological and technical triplicates. (G) BE(2)C cells were transfected with combinations of miRNA mimics and expression vectors, and impact on differentiation (neurite outgrowth) was measured 5 d later with Incucyte. Pictures on the left show aspect of transfected cells. Graphs on the right show relative neurite length in each condition. Experiment was performed using biological duplicates and technical quadruplicates. Data was analyzed using Student's t-test and are presented as the mean ± standard deviation t-test. (*) P < 0.05, (**) P < 0.001, (***) P < 0.0001. (H) Msi1 and miR-137 and their opposite impact on cell fate decisions. In our antagonistic model, miR-137 drives differentiation (tumor suppression) using a double negative switch: first, by direct inhibition of Msi1 and second, by repressing the expression of their shared targets. On the other hand, Msi1 positive impact on the expression of shared targets is central in its function in self-renewal, proliferation, and tumorigenesis.

Similar articles

Cited by

References

    1. Abaza HMH, Elmougy MI, El Maraghy HMA, Mahmoud HM. 2016. Stanniocalcin1 gene expression in patients with acute leukemia: impact on response to therapy and disease outcome. Int J Lab Hematol 38: 81–89. 10.1111/ijlh.12445 - DOI - PubMed
    1. Agarwal V, Bell GW, Nam J-W, Bartel DP. 2015. Predicting effective microRNA target sites in mammalian mRNAs. Elife 4: e05005 10.7554/eLife.05005 - DOI - PMC - PubMed
    1. Aldape K, Zadeh G, Mansouri S, Reifenberger G, von Deimling A. 2015. Glioblastoma: pathology, molecular mechanisms and markers. Acta Neuropathol 129: 829–848. 10.1007/s00401-015-1432-1 - DOI - PubMed
    1. Arora S, Rana R, Chhabra A, Jaiswal A, Rani V. 2013. MiRNA-transcription factor interactions: a combinatorial regulation of gene expression. Mol Genet Genomics 288: 77–87. 10.1007/s00438-013-0734-z - DOI - PubMed
    1. Banelli B, Forlani A, Allemanni G, Morabito A, Pistillo MP, Romani M. 2017. MicroRNA in glioblastoma: an overview. Int J Genomics 2017: 7639084 10.1155/2017/7639084 - DOI - PMC - PubMed

Publication types

MeSH terms

LinkOut - more resources