. 2019 Apr 19;4(34):eaaw4341.
doi: 10.1126/sciimmunol.aaw4341.

A specific gene-microbe interaction drives the development of Crohn's disease-like colitis in mice

Affiliations

A specific gene-microbe interaction drives the development of Crohn's disease-like colitis in mice

R Caruso et al. Sci Immunol. .

Abstract

Bacterial dysbiosis is associated with Crohn's disease (CD), a chronic intestinal inflammatory disorder thought to result from an abnormal immune response against intestinal bacteria in genetically susceptible individuals. However, it is unclear whether dysbiosis is a cause or consequence of intestinal inflammation and whether overall dysbiosis or specific bacteria trigger the disease. Here, we show that the combined deficiency of NOD2 and phagocyte NADPH oxidase, two CD susceptibility genes, triggers early-onset spontaneous TH1-type intestinal inflammation in mice with the pathological hallmarks of CD. Disease was induced by Mucispirillum schaedleri, a Gram-negative mucus-dwelling anaerobe. NOD2 and CYBB deficiencies led to marked accumulation of Mucispirillum, which was associated with impaired neutrophil recruitment and killing of the bacterium by luminal neutrophils. Maternal immunoglobulins against Mucispirillum protected mutant mice from disease during breastfeeding. Our results indicate that a specific intestinal microbe triggers CD-like disease in the presence of impaired clearance of the bacterium by innate immunity.


Conflict of interest statement

Competing interests: The authors declare that they have no competing interests.

Figures

Fig. 1.
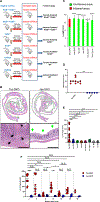
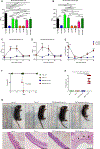
Fig. 1.. Doubly deficient Nod2/Cybb mice develop earlyonset spontaneous CD-like colitis when exposed to a specific microbiota.
(A) Schematic representation of the experimental design for fostering experiments. WT or mutant pups were fostered to either Jackson (Jax) or Taconic (Tac) dams within 2 days after birth. Six groups of fostered mice were generated: Tac-DKO, Jax-DKO, Tac-WT, Jax-WT, Tac-Nod2−/−, and Tac-Cybb−/−. (B) Representative histology of H&E-stained colonic sections from ~4-week-old Jax-DKO and Tac-DKO mice. Top panels show colonic rolls with inflamed areas (red) and uninflamed areas (green). Scale bars, 1000 μm. Bottom panels show high-powered images. The arrowhead shows a narrow and deep ulcer. Black arrows indicate colonic transmural inflammation and regenerating crypt epithelia in Tac-DKO; green arrows show uninvolved colon in Jax-DKO. Scale bars, 500 μm. (C) Quantification of inflammatory involvement in colons of ~4-week-old fostered mice. Graphs indicate mean ± SD of at least five individual mice. One-way analysis of variance (ANOVA) followed by Tukey’s multiple comparisons test. **** P < 0.0001, data are from four independent experiments. (D) Histopathological scores of cecal and colonic tissues from Tac-DKO (n = 10) and Jax-DKO (n = 5) mice. Bars show median; data are from three independent experiments. Two-tailed Mann-Whitney U test. *** P = 0.0003. (E) Fecal Lcn-2 concentration in Tac-DKO (n = 38), Jax-DKO (n = 24), Tac-WT (n = 20), Jax-WT (n = 19), Tac-Nod2−/− (n = 16), Tac-Cybb−/− (n = 16), Tac C57BL/6 (Tac B6) (n = 10), and Jax C57BL/6 mice (Jax B6) (n = 10). Non-fostered Tac C57BL/6 (Tac B6) and Jax C57BL/6 (Jax B6) mice are included as controls. Bars show median; data are from three independent experiments. (F) Lcn-2 concentration was measured over time in fecal samples from Tac-DKO (n ≤ 12) and Jax-DKO (n ≤ 7) mice. Bars show median; data are pooled from three independent experiments. (E and F) Kruskal-Wallis test followed by Dunn’s post test. * P < 0.05; ** P < 0.01; *** P < 0.001; **** P < 0.0001; N.S., not significant.
Fig. 2.
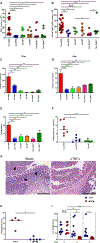
Fig. 2.. Doubly deficient Nod2/Cybb mice harboring Taconic microbiota develop TH1-type colitis.
(A) Total number of LP CD4+ T cells from 4-to 6-week-old mice (Tac-DKO, n = 19; Jax-DKO, n = 6; Tac-WT, n = 7; Jax-WT, n = 8; Tac-Nod2−/−, n = 7; and Tac-Cybb−/−, n = 6). (B) Total number of LP neutrophils from 4- to 6-week-old mice (Tac-DKO, n = 20; Jax-DKO, n = 5; Tac-WT, n = 5; Jax-WT, n = 6; Tac-Nod2−/−, n = 7; and Tac-Cybb−/−, n = 6). (A and B) Bars show median; data are from five independent experiments. Kruskal-Wallis test followed by Dunn’s post test. *P < 0.05; ***P < 0.001; ****P < 0.0001. (C and D) LPMCs were isolated from 4- to 6-week-old fostered mice. Gene expression in LPMCs was normalized to glyceraldehyde-3-phosphate dehydrogenase (GAPDH) expression. Data are mean ± SEM of at least five individual mice; data are from four independent experiments. *P < 0.05; **P < 0.01; ***P < 0.001; ****P < 0.0001 by one-way ANOVA followed by Tukey’s multiple comparisons test. (E) Total LPMCs from 4- to 6-week-old fostered mice were cultured for 12 hours. TNFα from culture supernatant was measured by ELISA (at least three individual mice each group). Data are mean ± SEM; data are from two independent experiments. *P < 0.05; **P < 0.01; ***P < 0.001 by one-way ANOVA followed by Tukey’s multiple comparisons test. (F)Percentages of IFN-γ–producing CD4+ T cells isolated from 4- to 6-week-old Tac-DKO (n = 7), Jax-DKO (n = 6), and Tac-WT (n = 7). Each dot represents an individual mouse. Bars show median; data are from three independent experiments. *P < 0.05; **P < 0.01 by Kruskal-Wallis test followed by Dunn’s multiple comparisons test. (G) Representative histology of H&E-stained colonic sections from Tac-DKO mice injected with anti-TNFα antibody (αTNFα) or control IgG (sham). Arrows show inflammatory cell infiltrate and epithelial crypt damage. Scale bars, 500 μm. (H) Histopathological scores of colonic tissue from anti–TNFα-treated Tac-DKO (n = 5) and from sham-treated Tac-DKO mice (n = 4) on day 9 after injection. Each dot represents an individual mouse. Bars show median; data are from two independent experiments; *P = 0.0159 by two-tailed Mann-Whitney U test. (I) Fecal Lcn-2 concentration in Tac-DKO mice treated with anti-TNFα antibody (n = 9) or control isotype–matched antibody (sham) (n = 9) before injection (day 0) and on day 6 and on day 9 after injection. Bars show median; data are from two independent experiments. Kruskal-Wallis test followed by Dunn’s post test. *P < 0.05; **P < 0.01; ***P < 0.001.
Fig. 3.
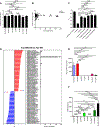
Fig. 3.. Selective accumulation of the Mucispirillum pathobiont in doubly deficient Nod2/Cybb mice.
(A) Shannon’s diversity index of fecal samples from Tac- and Jax-fostered mice. Tac-DKO NI (n = 12), Tac-DKO I (n = 13), Jax-DKO (n = 10), Tac-WT (n = 7), Jax-WT (n = 7), Tac-Nod2−/− (n = 13), and Tac-Cybb−/− (n = 8). Results are mean ± SD. Data are pooled from two independent experiments. One-way ANOVA followed by Tukey’s multiple comparisons test. (B) Correlation between levels of fecal Lcn-2 and Shannon’s diversity index of fecal samples from Tac-DKO mice (n = 75). Data are pooled from five independent experiments. Spearman’s rank correlation. (C) Average θyc distance within or between groups of Jax mothers (J mothers, n = 4), Tac mothers (T mothers, n = 6), Jax-born DKO (J mother T-fostered DKO, n = 17), Cybb−/− (J mother T-fostered Cybb−/−, n = 8), Nod2−/− (J mother T-fostered Nod2−/−, n = 13), and WT mice (J mother T-fostered WT, n = 7) fostered to Tac mothers. Data are mean ± SEM; data are from two independent experiments. Kruskal-Wallis test followed by Dunn’s post test. *P < 0.05; ***P < 0.001; ****P < 0.0001. (D) LEfSe analysis shows bacterial OTUs that were differentially abundant between age-matched Tac-DKO mice before the onset of intestinal inflammation (Tac-DKO NI, n = 12) and Tac-WT animals (n = 7). The LDA score and the abundance ratio are shown. The arrow indicates the specific OTU that belongs to Mucispirillum. Asterisks indicate bacteria under detection (zero read) in 16S ribosomal RNA (rRNA) gene Illumina MiSeq analysis in denominator groups. Data are pooled from two independent experiments. (E) Presence of Mucispirillum in fecal DNA extracted from 3- to 4-week-old Tac-DKO NI (n = 12), Tac-DKO I (n = 13), Jax-DKO (n = 10), Tac-WT (n = 7), Jax-WT (n = 7), Tac-Nod2−/− (n = 13), and Tac-Cybb−/− (n = 8) and normalized to the universal 16S rRNA gene. Results are mean ± SEM; data are from two independent experiments. ***P < 0.001; ****P < 0.0001 by Kruskal-Wallis test followed by Dunn’s post test. (F) The presence of SFB in fecal DNA was quantified in fecal samples collected from 3- to 4-week-old Tac- and Jax-fostered mice. Results were normalized to the universal 16S rRNA gene. Small intestinal contents from Taconic C57BL/6 mice (Tac-ileal content) were used as positive control for the presence of SFB. Mean ± SEM of at least five mice. Data are pooled from two independent experiments. ***P < 0.001; ****P < 0.0001 by one-way ANOVA followed by Tukey’s multiple comparisons test.
Fig. 4.
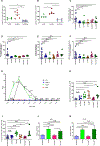
Fig. 4.. Nod2 and Cybb regulate neutrophil recruitment and killing to control Mucispirillum accumulation.
(A) Total number of colonic neutrophils isolated from ~4-week-old Tac-DKO NI (n = 6), Tac-DKO I (n = 6), and Tac-WT (n = 4). Bars show mean; data are from two independent experiments. *P < 0.05; **P < 0.01 by one-way ANOVA followed by Tukey’s multiple comparisons test. (B) Total number of luminal neutrophils isolated from ~4-week-old Tac-DKO NI (n = 4), Tac-DKO I (n = 5), and Tac-WT (n = 4). Bars show median; data are from two independent experiments. *P < 0.05 by Kruskal-Wallis test followed by Dunn’s post test. (C)Presence of Mucispirillum in luminal neutrophils isolated from ~5-week-old Tac-DKO NI (n = 13), Jax-DKO (n = 7), Tac-WT (n = 7), Jax-WT (n = 6), Tac-Nod2−/− (n = 6), and Tac-Cybb−/− (n = 7). Bars indicate median; data are from five independent experiments. (D) Presence of Mucispirillum in LP neutrophils (~5-week-old mice; Tac-DKO NI, n = 17; Jax-DKO, n = 7; Tac-WT, n = 8; Jax-WT, n = 10; Tac-Nod2−/−, n = 8; Tac-Cybb−/−, n = 6). Bars show median; data are from four independent experiments. (E and F) Presence of Firmicutes (E) and A. muciniphila (F) in LP neutrophils (~5-week-old mice; Tac-DKO NI, n = 17; Jax-DKO, n = 7; Tac-WT, n = 8; Jax-WT, n = 10; Tac-Nod2−/−, n = 8; and Tac-Cybb−/−, n = 6). Bars indicate median; data are from four independent experiments. (C to F) Results were normalized to GAPDH expression. Kruskal-Wallis test followed by Dunn’s post test. *P < 0.05; **P < 0.01; ***P < 0.001; ****P < 0.0001. (G) Representative chemiluminescence curves of ROS production frombone marrow–derived neutrophils isolated from Tac-WT (n = 3), Tac-Cybb−/− (n = 3), Tac-Nod2−/− (n = 3), and Tac-DKO (n = 3) mice activated by PMA. The relative light units (RLU) were monitored at 98-s intervals and shown up to 14.42 min. Results are mean ± SEM; data are from three independent experiments. **P < 0.01; ****P < 0.0001 by two-way ANOVA followed by Tukey’s multiple comparisons test. (H) Total number of LP neutrophils (~5-week-old mice; age-matched Tac-DKO NI, n = 6; Jax-DKO, n = 6; Tac-WT, n = 7; Jax-WT, n = 7; Tac-Nod2−/−, n = 7; and Tac-Cybb−/−, n = 6). Bars show median; data are from three independent experiments. (I) Absolute number of luminal neutrophils isolated from ~5-week-old, age-matched Tac-DKO NI (n = 15), Jax-DKO (n = 7), Tac-WT (n = 7), Jax-WT (n = 6), Tac-Nod2−/− (n = 6), and Tac-Cybb−/− (n = 7). Bars indicate median; data are from five independent experiments. (H and I) Kruskal-Wallis test followed by Dunn’s post test. *P < 0.05; **P < 0.01. (J and K) Gene expression in colonic tissues harvested from fostered mice. Results were normalized to GAPDH. Results are mean ± SEM of at least six individual mice; data are from two independent experiments. *P < 0.05; **P < 0.01 by one-way ANOVA followed by Tukey’s multiple comparisons test.
Fig. 5.
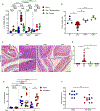
Fig. 5.. Maternal Igs protect doubly deficient Nod2/Cybb mice from the development of colitis.
ELISA of Mucispirillum-specific IgA (A) and IgG (B) in the luminal content of fostered mice. Non-fostered Tac C57BL/6 (Tac B6) and Jax C57BL/6 (Jax B6) mice were included as controls. Data are mean ± SEM of at least six individual mice; data are from two independent experiments. **P < 0.01; ***P < 0.001;****P<0.0001byone-way ANOVA followed by Tukey’s multiple comparisons test. ELISA of Mucispirillum-specific IgA (C) and IgG (D) in the luminal content of Tac-DKO(n = 8) and Jax-DKO (n =6) mice. Results are mean ± SD; data are from two independent experiments. (E) Fecal Lcn-2 concentration in Tac-DKO (n = 8) and Jax-DKO (n = 6) mice. Data are mean ± SD; data are from two independent experiments. (C to E) Two-way ANOVA followed by Sidak’s multiple comparisons test. **P < 0.01; ***P < 0.001; ****P < 0.0001. (F) Mouse survival over time after fostering newborns DKO to either Jax JH−/− (DKO to Jax JH−/−, n = 7) or to Tac-exposed JH−/− mothers (DKO to Tac JH−/−, n = 15). Newborn Jax JH−/− (n = 7) and Tac JH−/− (n = 7) pups were included as controls. Data are from two independent experiments. Log-rank test. (G) Representative images (top) and H&E-stained colonic sections (bottom) from 9-day-old DKO fostered to Jax JH−/− or to Tac JH−/− mothers and Jax JH−/− and Tac JH−/− pups. Scale bars, 500 µm. (H) Histopathological scores of colonic tissues from (9-day-old) DKO fostered to Jax JH−/− (n = 6) or Tac JH−/− mothers (n = 15) and Jax JH −/− (n = 3) and Tac JH −/− mice (n = 3). Bars show median; data are from two independent experiments. *P < 0.05; **P < 0.01 by Kruskal-Wallis test followed by Dunn’s post test.
Fig. 6.
Fig. 6.. Mucispirillum triggers intestinal inflammation in doubly deficient Nod2/Cybb mice.
SPF Jax WT (n = 4), DKO (n = 21), Nod2−/− (n = 4), and Cybb−/− (n = 4) mice were orally gavaged with either Mucispirillum or culture broth (sham) every other day up to 7 days. Lcn-2 concentration (A) was measured in fecal samples before (day 0) and 7 days after the first oral gavage. Colon length (B) was determined on day 7 after infection with Mucispirillum. (A and B) Bars show mean; data are from four independent experiments. **P < 0.01; ****P < 0.0001 by one-way ANOVA followed by Tukey’s multiple comparisons test. (C) Representative histology of H&E-stained sections from large intestines of Mucispirillum-infected WT, DKO, Nod2−/−, and Cybb−/− mice (on day 7 after infection). Arrows show inflammatory cell infiltrate. Scale bars, 500 μm. (D) Histopathological scores of cecal and colonic tissues from Mucispirillum-infected WT (n = 4), DKO (n = 21), Nod2−/− (n = 4), and Cybb−/− (n = 4) mice (on day 7 after infection). Bars show median; data are from four independent experiments. *P < 0.05 by Kruskal-Wallis test followed by Dunn’s post test. (E and F) SPF Jax-DKO mice were treated with an anti-CD20 monoclonal antibody (anti-CD20) (n = 10) or control antibody (sham) (n = 8) and then orally gavaged with Mucispirillum every other day up to 10 days. Fecal Lcn-2 concentration (E) was measured before (day 0), on day 5, and on day 10 after oral infection with Mucispirillum. Colon length (F) was measured in anti–CD20-treated DKO (n = 10) and in sham-treated DKO mice (n = 8) on day 10 after infection. Bars show mean; data are from two independent experiments. One-way ANOVA followed by Tukey’s multiple comparisons test. **P < 0.01; ****P < 0.0001 in (E); **P = 0.013 by two-tailed unpaired t test in (F).

Comment in

  • A microbial trigger for colitis.
    Bordon Y. Bordon Y. Nat Rev Immunol. 2019 Jun;19(6):350-351. doi: 10.1038/s41577-019-0175-y. Nat Rev Immunol. 2019. PMID: 31068684 No abstract available.

Similar articles

Cited by

References

    1. Baumgart DC, Sandborn WJ, Crohn’s disease. Lancet 380, 1590–1605 (2012). - PubMed
    1. Bouma G, Strober W, The immunological and genetic basis of inflammatory bowel disease. Nat. Rev. Immunol 3, 521–533 (2003). - PubMed
    1. Hedrick TL, Friel CM, Colonic crohn disease. Clin. Colon Rectal Surg 26, 84–89 (2013). - PMC - PubMed
    1. Benchimol EI, Guttmann A, Griffiths AM, Rabeneck L, Mack DR, Brill H, Howard J, Guan J, To T, Increasing incidence of paediatric inflammatory bowel disease in Ontario, Canada: Evidence from health administrative data. Gut 58, 1490–1497 (2009). - PubMed
    1. Herrinton LJ, Liu L, Lewis JD, Griffin PM, Allison J, Incidence and prevalence of inflammatory bowel disease in a Northern California managed care organization, 1996–2002. Am. J. Gastroenterol 103, 1998–2006 (2008). - PubMed

Publication types

MeSH terms

Supplementary concepts