

Disruption of the MBD2-NuRD complex but not MBD3-NuRD induces high level HbF expression in human adult erythroid cells
- PMID: 31004025
- PMCID: PMC6959176
- DOI: 10.3324/haematol.2018.210963
Disruption of the MBD2-NuRD complex but not MBD3-NuRD induces high level HbF expression in human adult erythroid cells
Abstract
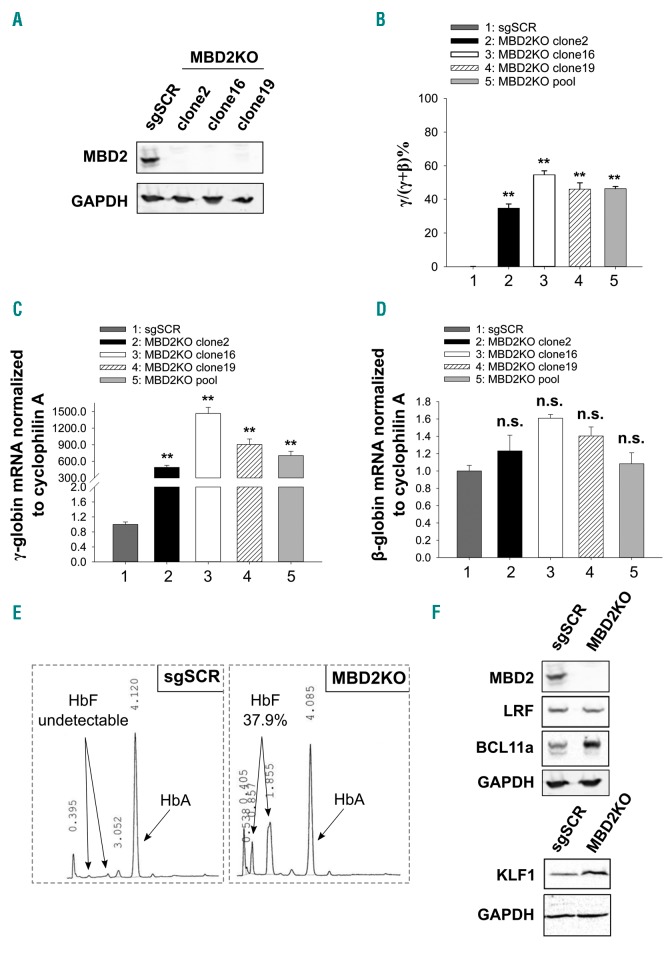
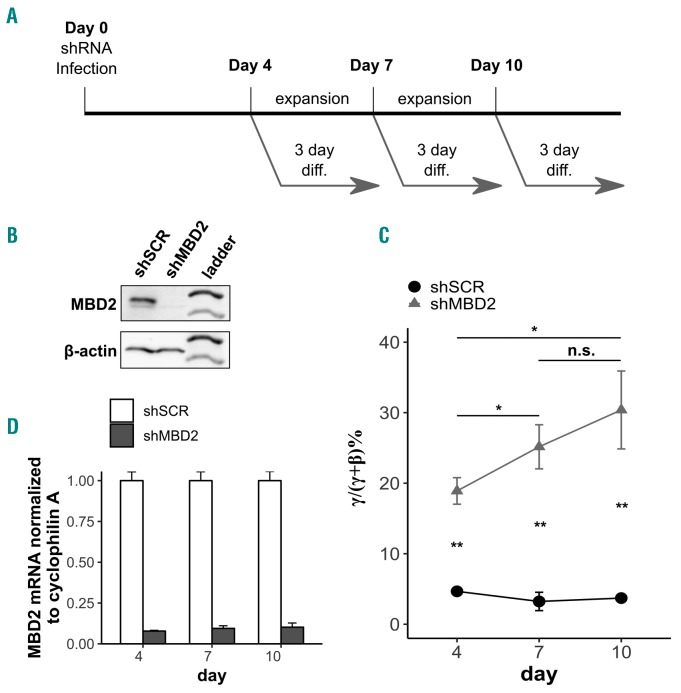
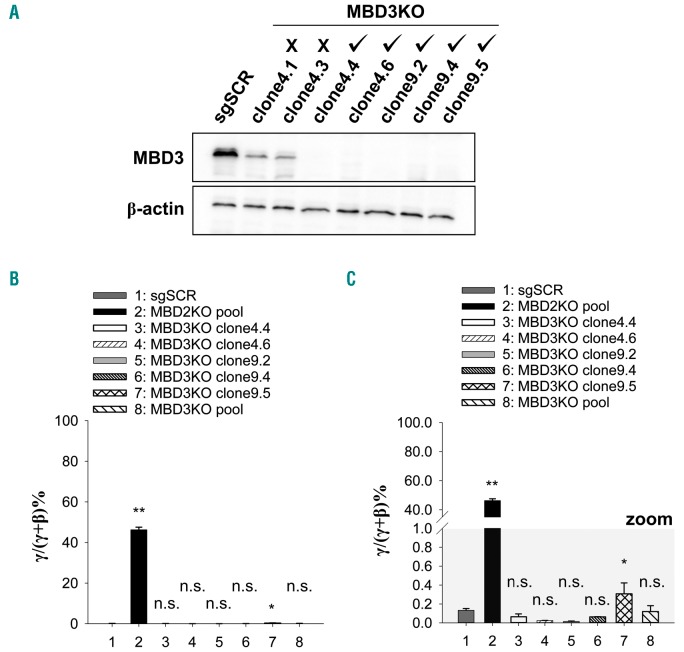
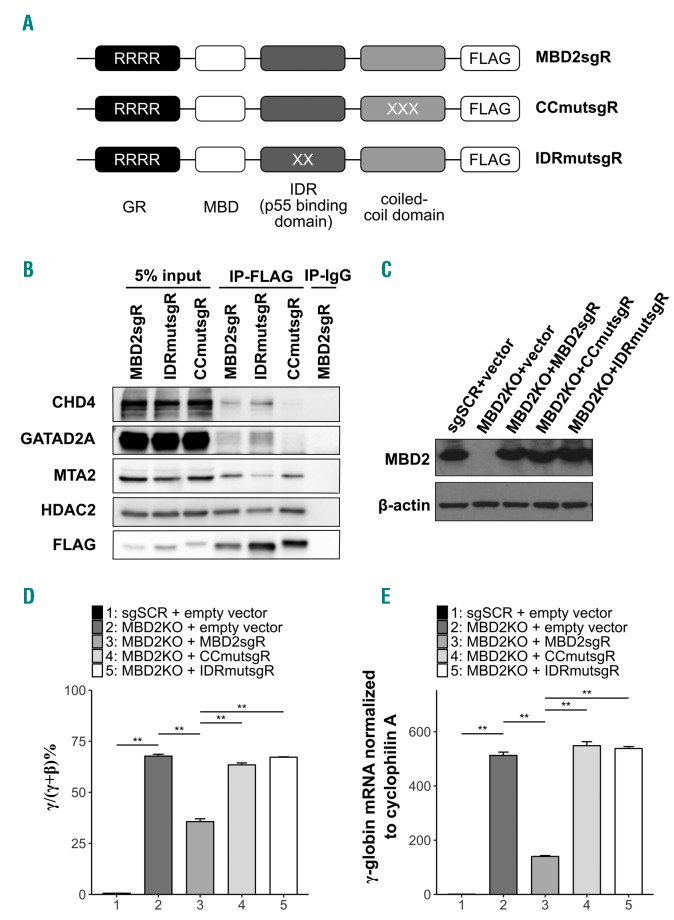
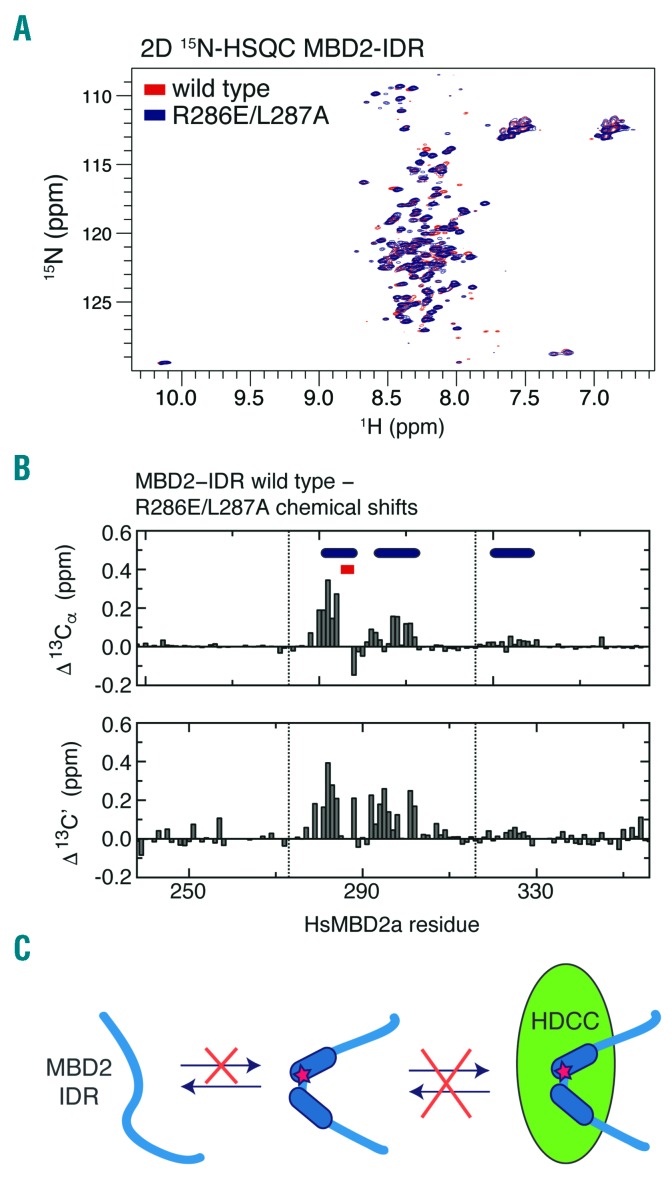
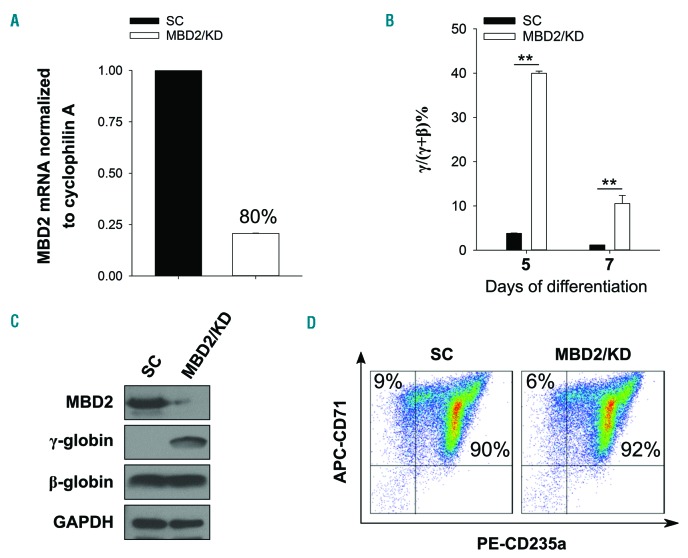
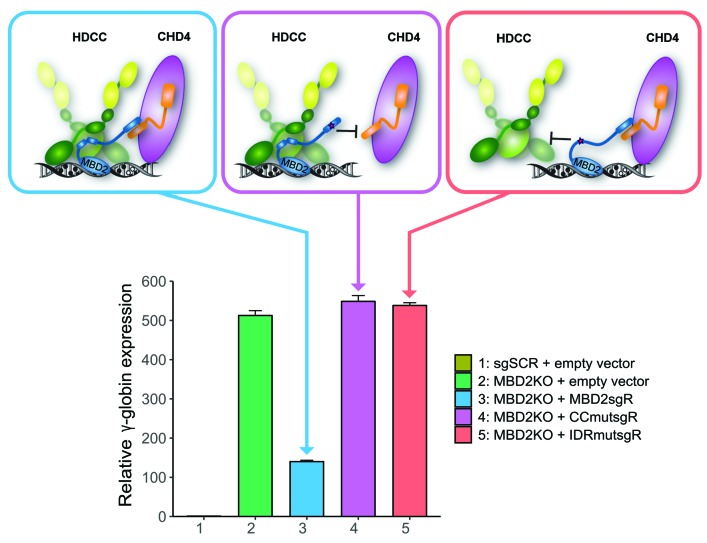
As high fetal hemoglobin levels ameliorate the underlying pathophysiological defects in sickle cell anemia and beta (β)-thalassemia, understanding the mechanisms that enforce silencing of fetal hemoglobin postnatally offers the promise of effective molecular therapy. Depletion of the Nucleosome Remodeling and Deacetylase complex member MBD2 causes a 10-20-fold increase in γ-globin gene expression in adult β-globin locus yeast artificial chromosome transgenic mice. To determine the effect of MBD2 depletion in human erythroid cells, genome editing technology was utilized to knockout MBD2 in Human Umbilical cord Derived Erythroid Progenitor-2 cells resulting in γ/γ+β mRNA levels of approximately 50% and approximately 40% fetal hemoglobin by high performance liquid chromatography. In contrast, MBD3 knockout had no appreciable effect on γ-globin expression. Knockdown of MBD2 in primary adult erythroid cells consistently increased γ/γ+β mRNA ratios by approximately 10-fold resulting in approximately 30-40% γ/γ+β mRNA levels and a corresponding increase in γ-globin protein. MBD2 exerts its repressive effects through recruitment of the chromatin remodeler CHD4 via a coiled-coil domain, and the histone deacetylase core complex via an intrinsically disordered region. Enforced expression of wild-type MBD2 in MBD2 knockout cells caused a 5-fold decrease in γ-globin mRNA while neither the coiled-coil mutant nor the intrinsically disordered region mutant MBD2 proteins had an inhibitory effect. Co-immunoprecipitation assays showed that the coiled-coil and intrinsically disorder region mutations disrupt complex formation by dissociating the CHD4 and the histone deacetylase core complex components, respectively. These results establish the MBD2 Nucleosome Remodeling and Deacetylase complex as a major silencer of fetal hemoglobin in human erythroid cells and point to the coiled-coil and intrinsically disordered region of MBD2 as potential therapeutic targets.
Copyright© 2019 Ferrata Storti Foundation.
Figures
Comment in
-
A new target for fetal hemoglobin reactivation.Haematologica. 2019 Dec;104(12):2325-2327. doi: 10.3324/haematol.2019.230904. Haematologica. 2019. PMID: 31787612 Free PMC article. No abstract available.
Similar articles
-
Mi2β-mediated silencing of the fetal γ-globin gene in adult erythroid cells.Blood. 2013 Apr 25;121(17):3493-501. doi: 10.1182/blood-2012-11-466227. Epub 2013 Feb 26. Blood. 2013. PMID: 23444401 Free PMC article.
-
p66Alpha-MBD2 coiled-coil interaction and recruitment of Mi-2 are critical for globin gene silencing by the MBD2-NuRD complex.Proc Natl Acad Sci U S A. 2011 May 3;108(18):7487-92. doi: 10.1073/pnas.1015341108. Epub 2011 Apr 13. Proc Natl Acad Sci U S A. 2011. PMID: 21490301 Free PMC article.
-
GATA zinc finger domain-containing protein 2A (GATAD2A) deficiency reactivates fetal haemoglobin in patients with β-thalassaemia through impaired formation of methyl-binding domain protein 2 (MBD2)-containing nucleosome remodelling and deacetylation (NuRD) complex.Br J Haematol. 2021 Jun;193(6):1220-1227. doi: 10.1111/bjh.17511. Epub 2021 May 17. Br J Haematol. 2021. PMID: 33997955
-
C2H2 Zinc Finger Transcription Factors Associated with Hemoglobinopathies.J Mol Biol. 2024 Apr 1;436(7):168343. doi: 10.1016/j.jmb.2023.168343. Epub 2023 Nov 2. J Mol Biol. 2024. PMID: 37924864 Free PMC article. Review.
-
Epigenetic regulation of fetal globin gene expression in adult erythroid cells.Transl Res. 2015 Jan;165(1):115-25. doi: 10.1016/j.trsl.2014.05.002. Epub 2014 May 11. Transl Res. 2015. PMID: 24880147 Free PMC article. Review.
Cited by
-
Direct Generation of Immortalized Erythroid Progenitor Cell Lines from Peripheral Blood Mononuclear Cells.Cells. 2021 Mar 1;10(3):523. doi: 10.3390/cells10030523. Cells. 2021. PMID: 33804564 Free PMC article.
-
Genome editing strategies for fetal hemoglobin induction in beta-hemoglobinopathies.Hum Mol Genet. 2020 Sep 30;29(R1):R100-R106. doi: 10.1093/hmg/ddaa088. Hum Mol Genet. 2020. PMID: 32406490 Free PMC article. Review.
-
In silico prediction and interaction of resveratrol on methyl-CpG binding proteins by molecular docking and MD simulations study.RSC Adv. 2022 Apr 13;12(18):11493-11504. doi: 10.1039/d2ra00432a. eCollection 2022 Apr 7. RSC Adv. 2022. PMID: 35425086 Free PMC article.
-
Analysis of the complex between MBD2 and the histone deacetylase core of NuRD reveals key interactions critical for gene silencing.Proc Natl Acad Sci U S A. 2023 Aug 15;120(33):e2307287120. doi: 10.1073/pnas.2307287120. Epub 2023 Aug 8. Proc Natl Acad Sci U S A. 2023. PMID: 37552759 Free PMC article.
-
Exploring epigenetic and microRNA approaches for γ-globin gene regulation.Exp Biol Med (Maywood). 2021 Nov;246(22):2347-2357. doi: 10.1177/15353702211028195. Epub 2021 Jul 22. Exp Biol Med (Maywood). 2021. PMID: 34292080 Free PMC article. Review.
References
-
- Lettre G, Bauer DE. Fetal haemoglobin in sickle-cell disease: from genetic epidemiology to new therapeutic strategies. Lancet. 2016;387(10037):2554–2564. - PubMed
-
- Vichinsky EP. Changing patterns of thalassemia worldwide. Ann N Y Acad Sci. 2005;1054:18–24. - PubMed
-
- Gaziev J, Lucarelli G. Stem cell transplantation for hemoglobinopathies. Curr Opin Pediatr. 2003;15(1):24–31. - PubMed
-
- Olivieri NF. Reactivation of fetal hemoglobin in patients with beta-thalassemia. Semin Hematol. 1996;33(1):24–42. - PubMed
Publication types
MeSH terms
Substances
Grants and funding
LinkOut - more resources
Full Text Sources
Molecular Biology Databases
Research Materials
Miscellaneous
