. 2019 May 7;116(19):9370-9379.
doi: 10.1073/pnas.1821064116. Epub 2019 Apr 19.

Three-dimensional architecture of epithelial primary cilia

Affiliations

Three-dimensional architecture of epithelial primary cilia

Shufeng Sun et al. Proc Natl Acad Sci U S A. .

Abstract

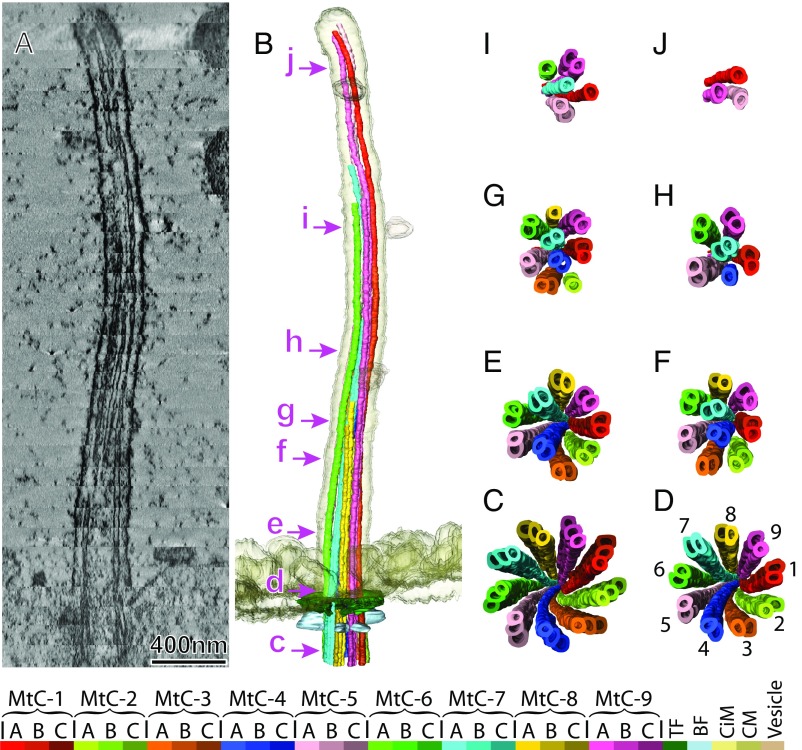
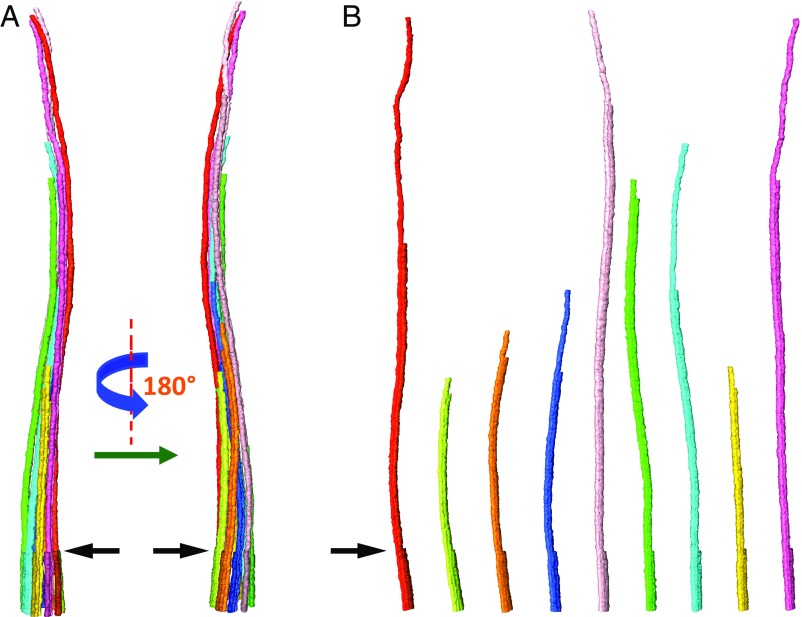
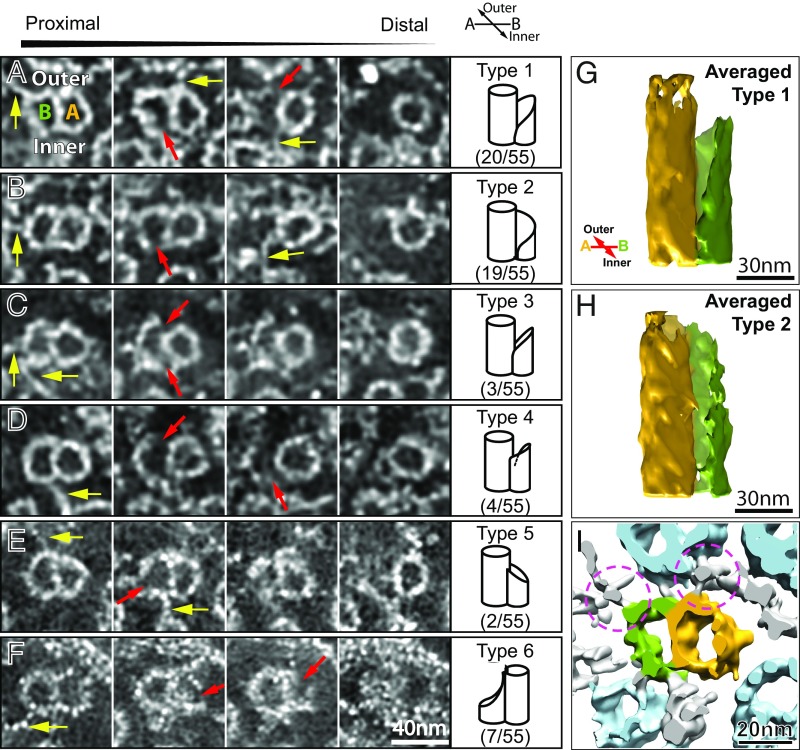
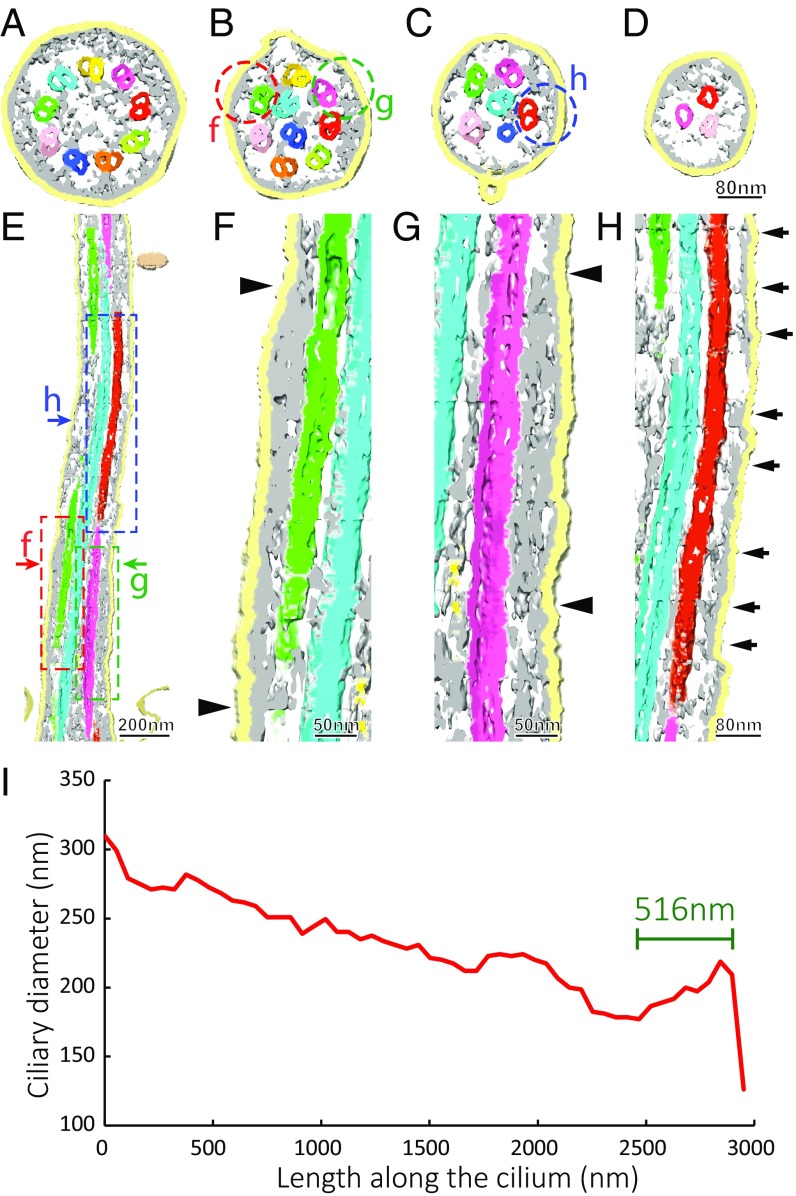
We report a complete 3D structural model of typical epithelial primary cilia based on structural maps of full-length primary cilia obtained by serial section electron tomography. Our data demonstrate the architecture of primary cilia differs extensively from the commonly acknowledged 9+0 paradigm. The axoneme structure is relatively stable but gradually evolves from base to tip with a decreasing number of microtubule complexes (MtCs) and a reducing diameter. The axonemal MtCs are cross-linked by previously unrecognized fibrous protein networks. Such an architecture explains why primary cilia can elastically withstand liquid flow for mechanosensing. The nine axonemal MtCs in a cilium are found to differ significantly in length indicating intraflagellar transport processes in primary cilia may be more complicated than that reported for motile cilia. The 3D maps of microtubule doublet-singlet transitions generally display longitudinal gaps at the inner junction between the A- and B-tubules, which indicates the inner junction protein is a major player in doublet-singlet transitions. In addition, vesicles releasing from kidney primary cilia were observed in the structural maps, supporting that ciliary vesicles budding may serve as ectosomes for cell-cell communication.

Keywords: 3D structure; electron microscopy; primary cilium.


Conflict of interest statement

The authors declare no conflict of interest.

Figures

Fig. 1.
Fig. 1.
Overview of the primary cilium structure. The typical primary cilium structural map obtained by combining 33 serial dual-axis tomograms. A longitudinal central slice of 13.4-nm thickness is shown in A (see also Movie S1). The structural model built from the serial tomograms using the Amira package is shown in B. Progressive changes of the microtubule configuration from proximal to distal end of the cilium are demonstrated by the end-on cross-section views shown in CJ that correspond to the locations marked in B (see also Movie S2). The viewing direction is from the basal to the distal end. The color key is shown at the bottom. BF, basal foot; CiM, ciliary membrane; CM, cytoplasmic membrane of the cell; MtC-A, -B, -C, microtubule complex A-, B-, C-tubule; TF, transition fiber.
Fig. 2.
Fig. 2.
Length profile of the MtCs in the axoneme. The axoneme structural model, shown in A, can be disassembled to extract individual MtCs sequentially, as shown in B (also see Movie S3). For each MtC, from the left to the right, the A-tubule and B-tubule are in slightly different colors following the color key in Fig. 1. The black arrows point to where triplets become doublets: location “d” marked in Fig. 1B, is also where the primary cilium starts to extend into extracellular space. The lengths of the nine MtCs within this primary cilium are different. They range from 0.9 to 3.0 µm. Please refer to SI Appendix, Fig. S3G for the length profile of the primary cilium.
Fig. 3.
Fig. 3.
Microtubule doublet-to-singlet transition. Six transition types are shown with their end-on views of sequential cross-sectional tomo-slices looking from the proximal end to the distal end (left to right) in AF. The upside of the doublet images face to the outer side. Red arrows in the tomo-slices point to the gap of the microtubule wall of protofilaments. The last column of the AF displays schematic illustrations and the population ratios for each type of transition. Type 1 and type 2 dominate the doublet–singlet transition occurrence. Their averaged density maps are displayed in G and H, respectively, which reveals a large gap at the inner junctions (see Movies S4 and S5 of the averaged 3D maps for the type 1 and 2 transition regions, respectively). A-tubules are displayed in yellow, B-tubules in green. The yellow arrows in the tomo-slices, AF, point to some fibrous structural components (inter-MT links). The volume rendering in I shows the same region of that in A, and demonstrates a fibrous feature of the inter-MT links (indicated by the magenta circles). The inter-MT links connect neighboring MtCs as seen in the magenta circle on the right. They are also found to extend further, as marked by the left magenta circle in I, toward the ciliary membrane, and finally join a dispersed density on the membrane (also see Fig. 4).
Fig. 4.
Fig. 4.
Protein networks linking the axonemal MtCs and the ciliary membrane and the ciliary envelope showing a decreasing diameter toward the distal tip. Cross-slices of the 3D density map rendered using the Chimera package are shown in AD at locations close to the “d,” “f,” “h,” and “i” arrows in Fig. 1B, respectively. The network-like densities are colored in gray, showing a wide distribution along the whole length of the primary cilium. At the basal region (shown in A), the nine doublets are linked to the ciliary membrane by somewhat Y-shaped densities. There are also long filaments connecting the MtCs to each other as shown in AC. The networks connecting the ciliary membrane and MtCs display two kinds of morphologies as shown in the longitudinal slice in E and magnified in FH. One is a continuous density as shown between the arrows in F and G, of which the cross-section views are circled in B. The other class of densities are discrete features as in H for which a cross-section view is circled in C. MtCs are colored following the color key in Fig. 1. The diameter of the membrane enveloped primary cilium decreases toward the distal tip, as shown in the profile in I (also see SI Appendix, Fig. S4 for diameter profiles of six additional primary cilia). The last B-tubule terminates 516-nm away from the axoneme tip end, which leaves three microtubule singlets present in the tip region (indicated by a green line in I).
Fig. 5.
Fig. 5.
Membrane vesicles along the surface of primary cilia. A ciliary membrane model (A) was generated by segmentation of the 3D structural map using the Amira package. Protrusions and vesicles on the ciliary membrane are highlighted by arrows in A, and the corresponding cross-sectional views are displayed in BE. A double-membrane vesicle was found as shown in D. The morphologies of the vesicles indicate they are released from the ciliary membrane.

References

    1. Brown JM, Witman GB. Cilia and diseases. Bioscience. 2014;64:1126–1137. - PMC - PubMed
    1. Pazour GJ, et al. Chlamydomonas IFT88 and its mouse homologue, polycystic kidney disease gene tg737, are required for assembly of cilia and flagella. J Cell Biol. 2000;151:709–718. - PMC - PubMed
    1. Braun DA, Hildebrandt F. Ciliopathies. Cold Spring Harb Perspect Biol. 2016;9:a028191. - PMC - PubMed
    1. Poole CA, Flint MH, Beaumont BW. Analysis of the morphology and function of primary cilia in connective tissues: A cellular cybernetic probe? Cell Motil. 1985;5:175–193. - PubMed
    1. Roth KE, Rieder CL, Bowser SS. Flexible-substratum technique for viewing cells from the side: Some in vivo properties of primary (9+0) cilia in cultured kidney epithelia. J Cell Sci. 1988;89:457–466. - PubMed

Publication types