. 2019 Apr 19;11(8):2241-2252.
doi: 10.18632/aging.101911.

Exposure to aristolochic acid I compromises the maturational competency of porcine oocytes via oxidative stress-induced DNA damage

Affiliations

Exposure to aristolochic acid I compromises the maturational competency of porcine oocytes via oxidative stress-induced DNA damage

Yu Zhang et al. Aging (Albany NY). .

Abstract

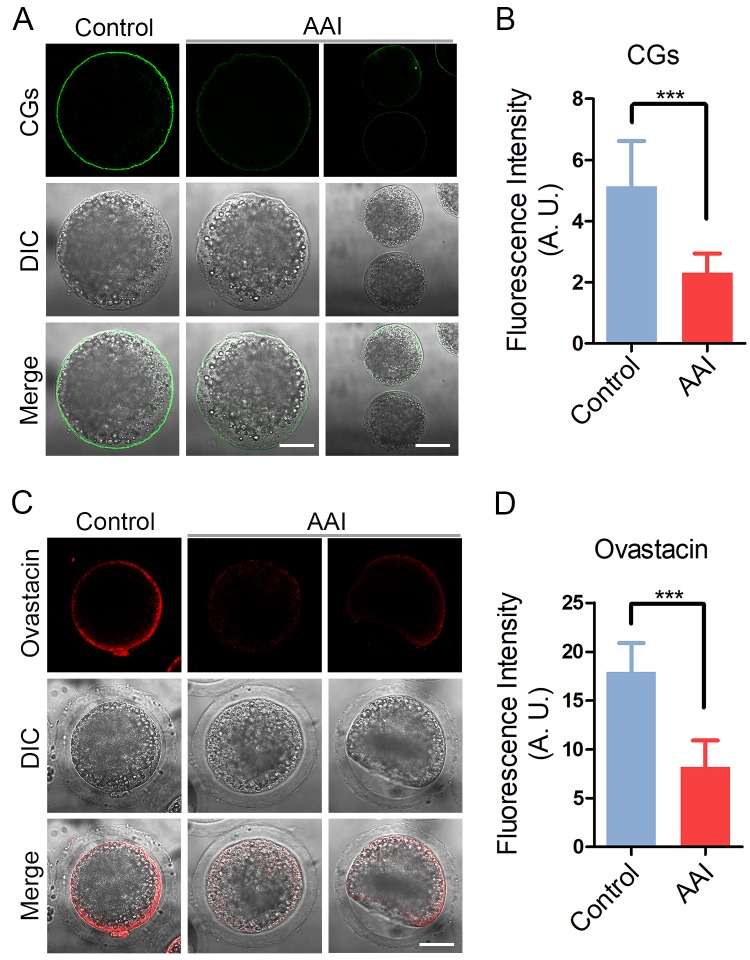
Aristolochic acid (AA) is a class of carcinogenic and nephrotoxic nitrophenanthrene carboxylic acids naturally found in Aristolochia plants. These plants have been widely used as herbal medicines and also enter the human food chain as the persistent soil pollutants. It has been known that AA exposure is implicated in multiple cancer types, kidney failure and ovarian dysfunction. However, whether AA exposure would influence the oocyte quality has not yet determined. Here, we document that AAI has the negative effects on the competency of oocyte maturation and fertilization. We show that AAI exposure leads to the oocyte meiotic failure via impairing the meiotic apparatus, displaying a prominently defective spindle assembly, actin dynamics and mitochondrial integrity. AAI exposure also causes the abnormal distribution of cortical granules and ovastacin, which is consistent with the observation that fewer sperm bound to the zona pellucida surrounding the unfertilized AAI-exposed eggs, contributing to the fertilization failure. In addition, AAI exposure induces the increased levels of ROS, DNA damage and early apoptosis in porcine oocytes. Collectively, we demonstrate that AAI exposure perturbs the oocyte meiotic progression and fertilization capacity via disruption of both nuclear maturation and cytoplasmic maturation of oocyte, which might be caused by the excessive oxidative stress-induced DNA damage and apoptosis.

Keywords: Aristolochic acid; DNA damage; fertilization capacity; oocyte maturation; oxidative stress.


Conflict of interest statement

CONFLICTS OF INTEREST: The authors have no conflicts of interest to disclose.

Figures

Figure 1
Figure 1
Effects of different doses of AAI on the porcine oocyte maturation. (A) Representative images of oocyte meiotic progression in control and AAI-exposed oocytes. Cumulus cell expansion of cumulus oocyte complexes (COCs) and polar body extrusion (PBE) of denuded oocytes (DOs) were imaged by the confocal microscope. Scale bar, 360 μm (a, e); 120 μm (b, f); 40 μm (c, g); 40 μm (d, h). (B) The rate of PBE was recorded in control and different concentrations of AAI-exposed groups (10 μM, 25 μM, 50 μM and 100 μM) after culture for 44 h in vitro. Data were presented as mean percentage (mean ± SEM) of at least three independent experiments. *P < 0.05, **P < 0.01, ***P < 0.001.
Figure 2
Figure 2
Effects of AAI exposure on the spindle/chromosome structure in porcine oocytes. (A) Representative images of spindle morphologies and chromosome alignment in control and AAI-exposed oocytes. Oocytes were immunostained with anti–α-tubulin-FITC antibody to visualize the spindles and were counterstained with propidium iodide (PI) to visualize the chromosomes. Scale bar, 10 μm. (B) The rate of aberrant spindles was recorded in control and AAI-exposed oocytes. (C) The rate of misaligned chromosomes was recorded in control and AAI-exposed oocytes. Data in (B) and (C) were presented as mean percentage (mean ± SEM) of at least three independent experiments. **P < 0.01.
Figure 3
Figure 3
Effects of AAI exposure on the acetylation level of α-tubulin in porcine oocytes. (A) Representative images of acetylated α-tubulin (Ac-Tub) in control and AAI-exposed oocytes. Oocytes were immunostained with anti-acetyl-α-tubulin (Lys-40) antibody to assess the acetylation level of α-tubulin. Scale bar, 10 μm. (B) Quantitative measurement of the fluorescence intensity of acetylated α-tubulin in control and AAI-exposed oocytes. Data were presented as mean percentage (mean ± SEM) of at least three independent experiments. ***P < 0.001. (C) The acetylation levels of α-tubulin in control and AAI-exposed oocytes were examined by western blotting. The blots were probed with anti-acetyl-α-tubulin (Lys-40) antibody and anti-Gapdh antibody, respectively.
Figure 4
Figure 4
Effects of AAI exposure on the actin dynamics in porcine oocytes. (A) Representative images of actin filaments in control and AAI-exposed oocytes. Oocytes were immunostained with anti-phalloidin-FITC antibody to visualize the actin filaments. Scale bar, 25 and 60 μm. (B) The fluorescence intensity profiling of actin filaments in oocytes. Lines were drawn through the oocytes, and pixel intensities were quantified along the lines. (C) The fluorescence intensity of actin signals was measured in control and AAI-exposed oocytes. Data were presented as mean percentage (mean ± SEM) of at least three independent experiments. ***P < 0.001.
Figure 5
Figure 5
Effects of AAI exposure on the distribution of mitochondria in porcine oocytes. (A) Representative images of mitochondrial staining in control and AAI-exposed oocytes. Scale bar, 20 μm. (B) Abnormal rates of mitochondrial distribution in control and AAI-exposed oocytes. (C) The fluorescence intensity of mitochondrial signals was measured in control and AAI-exposed oocytes. Data in (B) and (C) were presented as mean percentage (mean ± SEM) of at least three independent experiments. ***P < 0.001.
Figure 6
Figure 6
Effects of AAI exposure on the distribution of cortical granules and ovastacin in porcine oocytes. (A) Representative images of cortical granule localization in control and AAI-exposed oocytes. MII oocytes cultured for 44 h in vitro were stained with LCA-FITC to display the cortical granules. Scale bar, 30 and 60 μm. (B) The fluorescence intensity of cortical granules was measured around the signals on the plasma membrane in control and AAI-exposed oocytes. (C) Representative images of ovastacin localization in control and AAI-exposed oocytes. Ovastacin was immunostained with rabbit polyclonal anti-human ovastacin antibody and imaged by confocal microscope. Scale bar, 30 μm. (D) The fluorescence intensity of ovastacin was measured in control and AAI-exposed oocytes. Data in (B) and (D) were presented as mean percentage (mean ± SEM) of at least three independent experiments. ***P < 0.001.
Figure 7
Figure 7
Effects of AAI exposure on the sperm binding and fertilization of porcine oocytes. (A) Representative images of eggs and two-cell embryos bound by sperm. Eggs and two-cell embryos from control and AAI-exposed groups were incubated with capacitated sperm for 1 h to carry out the sperm binding assay. Scale bar, 30 μm. (B) The number of sperm binding to the surface of zona pellucida surrounding eggs from control and AAI-exposed groups was counted, respectively. (C) Representative images of fertilized eggs in control and AAI-exposed groups. Scale bar, 100μm (a, b); 50 μm (c, d). (D) In vitro fertilization rate was recorded in control and AAI-exposed oocytes. Data in (B) and (D) were presented as mean percentage (mean ± SEM) of at least three independent experiments. **P < 0.01, ***P < 0.001.
Figure 8
Figure 8
Effects of AAI exposure on the ROS level, DNA damage and early apoptosis in porcine oocytes. (A) Representative images of DCFH staining in control and AAI-exposed oocytes. Scale bar, 40 and 80 μm. (B) The fluorescence intensity of ROS levels was recorded in control and AAI-exposed oocytes. (C) Representative images of DHE staining in control and AAI-exposed oocytes. Scale bar, 20 and 5 μm. (D) The fluorescence intensity of ROS levels was recorded in control and AAI-exposed oocytes. (E) Representative images of DNA damage in control and AAI-exposed oocytes. Scale bar, 5 μm. (F) The fluorescence intensity of γH2AX signals was measured in control and AAI-exposed oocytes. (G) Representative images of apoptotic oocytes in control and AAI-exposed groups. Scale bar, 40 μm. (H) The rate of apoptotic oocytes was recorded in control and AAI-exposed groups. Data in (B), (D), (F) and (H) were presented as mean percentage (mean ± SEM) of at least three independent experiments. **P < 0.01, ***P < 0.001.

Similar articles

Cited by

References

    1. Li X, Wang H. Aristolochic acid nephropathy: what we know and what we have to do. Nephrology (Carlton). 2004; 9:109–11. 10.1111/j.1440-1797.2004.00252.x - DOI - PubMed
    1. Arlt VM, Stiborova M, Schmeiser HH. Aristolochic acid as a probable human cancer hazard in herbal remedies: a review. Mutagenesis. 2002; 17:265–77. 10.1093/mutage/17.4.265 - DOI - PubMed
    1. Yeh YH, Lee YT, Hsieh HS, Hwang DF. Short-term toxicity of aristolochic acid, aristolochic acid-I and aristolochic acid-II in rats. Food Chem Toxicol. 2008; 46:1157–63. 10.1016/j.fct.2007.11.015 - DOI - PubMed
    1. Liu Q, Wang Q, Yang X, Shen X, Zhang B. Differential cytotoxic effects of denitroaristolochic acid II and aristolochic acids on renal epithelial cells. Toxicol Lett. 2009; 184:5–12. 10.1016/j.toxlet.2008.10.020 - DOI - PubMed
    1. Shibutani S, Dong H, Suzuki N, Ueda S, Miller F, Grollman AP. Selective toxicity of aristolochic acids I and II. Drug Metab Dispos. 2007; 35:1217–22. 10.1124/dmd.107.014688 - DOI - PubMed

Publication types

LinkOut - more resources