

Pulsed Near Infrared Transcranial and Intranasal Photobiomodulation Significantly Modulates Neural Oscillations: a pilot exploratory study
- PMID: 31004126
- PMCID: PMC6474892
- DOI: 10.1038/s41598-019-42693-x
Pulsed Near Infrared Transcranial and Intranasal Photobiomodulation Significantly Modulates Neural Oscillations: a pilot exploratory study
Abstract
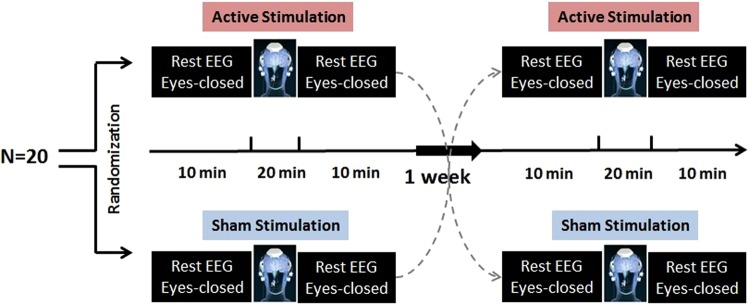
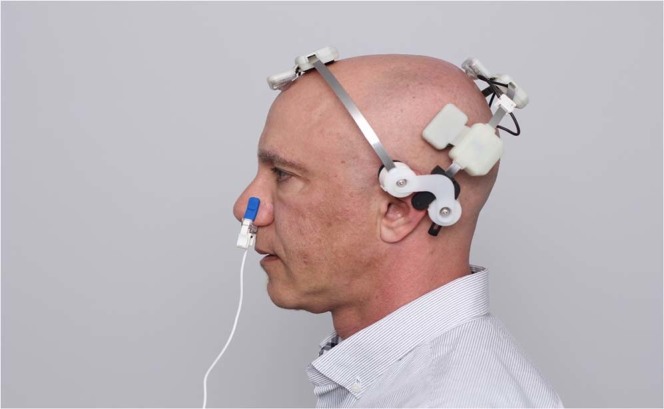
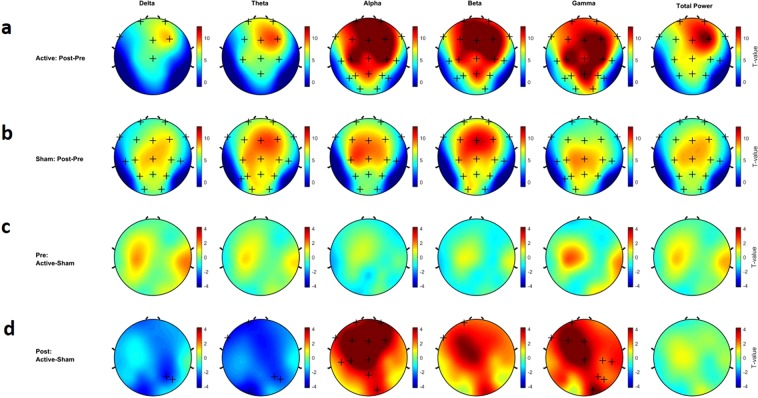
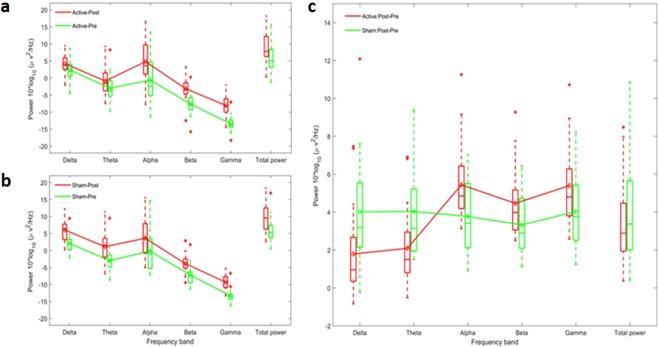
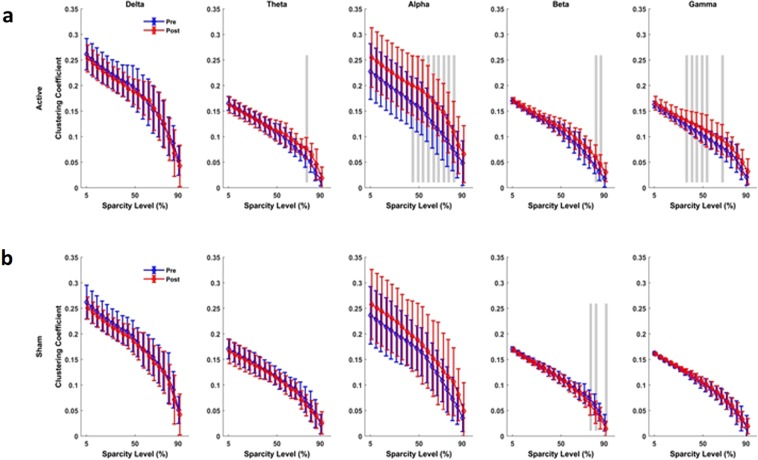
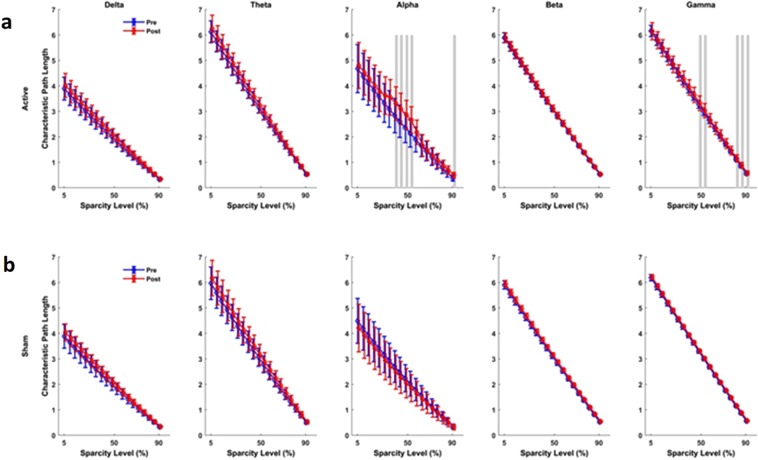
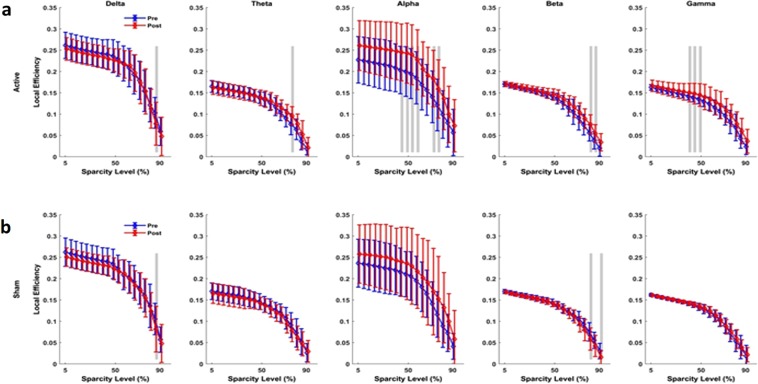
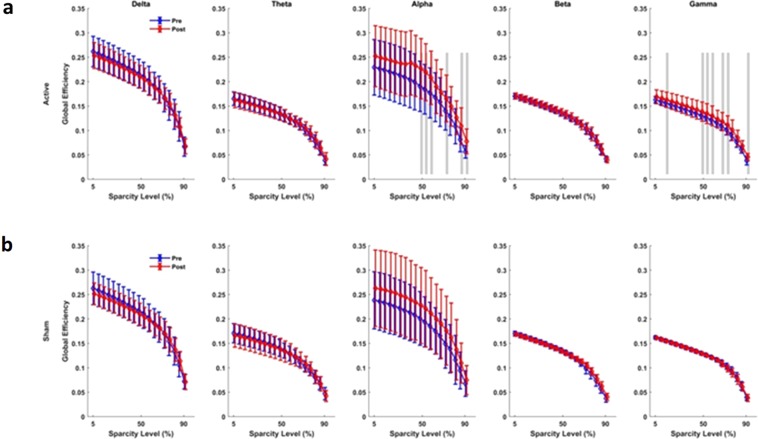
Transcranial photobiomodulation (tPBM) is the application of low levels of red or near-infrared (NIR) light to stimulate neural tissues. Here, we administer tPBM in the form of NIR light (810 nm wavelength) pulsed at 40 Hz to the default mode network (DMN), and examine its effects on human neural oscillations, in a randomized, sham-controlled, double-blinded trial. Using electroencephalography (EEG), we found that a single session of tPBM significantly increases the power of the higher oscillatory frequencies of alpha, beta and gamma and reduces the power of the slower frequencies of delta and theta in subjects in resting state. Furthermore, the analysis of network properties using inter-regional synchrony via weighted phase lag index (wPLI) and graph theory measures, indicate the effect of tPBM on the integration and segregation of brain networks. These changes were significantly different when compared to sham stimulation. Our preliminary findings demonstrate for the first time that tPBM can be used to non-invasively modulate neural oscillations, and encourage further confirmatory clinical investigations.
Conflict of interest statement
Reza Zomorrodi and Abhi Pushparaj were advisors to the device manufacturer, Vielight Inc., and were compensated for their time. They had no other competing or conflict of interest, financial and non-financial. Genane Loheswaran is an employee of Vielight Inc. as the Research Manager and Lew Lim is the Founder & Chief Executive Officer who owns shares in Vielight Inc., and both have no other competing interest. All the authors declare that these interests had no influence on the results and discussion in the study.
Figures
Similar articles
-
Pilot Study on Dose-Dependent Effects of Transcranial Photobiomodulation on Brain Electrical Oscillations: A Potential Therapeutic Target in Alzheimer's Disease.J Alzheimers Dis. 2021;83(4):1481-1498. doi: 10.3233/JAD-210058. J Alzheimers Dis. 2021. PMID: 34092636
-
Combination of Group Singular Value Decomposition and eLORETA Identifies Human EEG Networks and Responses to Transcranial Photobiomodulation.Front Hum Neurosci. 2022 May 10;16:853909. doi: 10.3389/fnhum.2022.853909. eCollection 2022. Front Hum Neurosci. 2022. PMID: 35620152 Free PMC article.
-
The Effect of Transcranial Pulsed Current Stimulation at 4 and 75 Hz on Electroencephalography Theta and High Gamma Band Power: A Pilot Study.Brain Connect. 2020 Nov;10(9):520-531. doi: 10.1089/brain.2020.0756. Epub 2020 Oct 23. Brain Connect. 2020. PMID: 32962422 Clinical Trial.
-
Effect of transcranial photobiomodulation on electrophysiological activity of brain in healthy individuals: A scoping review.J Clin Neurosci. 2023 Nov;117:156-167. doi: 10.1016/j.jocn.2023.09.029. Epub 2023 Oct 10. J Clin Neurosci. 2023. PMID: 37826867
-
Transcranial, Red/Near-Infrared Light-Emitting Diode Therapy to Improve Cognition in Chronic Traumatic Brain Injury.Photomed Laser Surg. 2016 Dec;34(12):610-626. doi: 10.1089/pho.2015.4037. Photomed Laser Surg. 2016. PMID: 28001756 Review.
Cited by
-
Emerging trends in the development of flexible optrode arrays for electrophysiology.APL Bioeng. 2023 Sep 7;7(3):031503. doi: 10.1063/5.0153753. eCollection 2023 Sep. APL Bioeng. 2023. PMID: 37692375 Free PMC article. Review.
-
Temporal and spectral analyses of EEG microstate reveals neural effects of transcranial photobiomodulation on the resting brain.Front Neurosci. 2023 Oct 17;17:1247290. doi: 10.3389/fnins.2023.1247290. eCollection 2023. Front Neurosci. 2023. PMID: 37916179 Free PMC article.
-
Improvements in clinical signs of Parkinson's disease using photobiomodulation: a prospective proof-of-concept study.BMC Neurol. 2021 Jul 2;21(1):256. doi: 10.1186/s12883-021-02248-y. BMC Neurol. 2021. PMID: 34215216 Free PMC article. Clinical Trial.
-
The gamma rhythm as a guardian of brain health.Elife. 2024 Nov 20;13:e100238. doi: 10.7554/eLife.100238. Elife. 2024. PMID: 39565646 Free PMC article. Review.
-
Photophysical Mechanisms of Photobiomodulation Therapy as Precision Medicine.Biomedicines. 2023 Jan 17;11(2):237. doi: 10.3390/biomedicines11020237. Biomedicines. 2023. PMID: 36830774 Free PMC article. Review.
References
Publication types
MeSH terms
LinkOut - more resources
Full Text Sources
Other Literature Sources
Medical
Molecular Biology Databases
Miscellaneous
