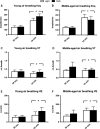
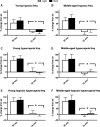
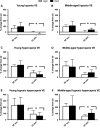
Young and middle-aged mouse breathing behavior during the light and dark cycles
- PMID: 31004390
- PMCID: PMC6474843
- DOI: 10.14814/phy2.14060
Young and middle-aged mouse breathing behavior during the light and dark cycles
Abstract
Unrestrained barometric plethysmography is a common method used for characterizing breathing patterns in small animals. One source of variation between unrestrained barometric plethysmography studies is the segment of baseline. Baseline may be analyzed as a predetermined time-point, or using tailored segments when each animal is visually calm. We compared a quiet, minimally active (no sniffing/grooming) breathing segment to a predetermined time-point at 1 h for baseline measurements in young and middle-aged mice during the dark and light cycles. Additionally, we evaluated the magnitude of change for gas challenges based on these two baseline segments. C57BL/6JEiJ x C3Sn.BliA-Pde6b+ /DnJ male mice underwent unrestrained barometric plethysmography with the following baselines used to determine breathing frequency, tidal volume (VT) and minute ventilation (VE): (1) 30-sec of quiet breathing and (2) a 10-min period from 50 to 60 min. Animals were also exposed to 10 min of hypoxic (10% O2 , balanced N2 ), hypercapnic (5% CO2 , balanced air) and hypoxic hypercapnic (10% O2 , 5% CO2 , balanced N2 ) gas. Both frequency and VE were higher during the predetermined 10-min baseline versus the 30-sec baseline, while VT was lower (P < 0.05). However, VE/VO2 was similar between the baseline time segments (P > 0.05) in an analysis of one cohort. During baseline, dark cycle testing had increased VT values versus those in the light (P < 0.05). For gas challenges, both frequency and VE showed higher percent change from the 30-sec baseline compared to the predetermined 10-min baseline (P < 0.05), while VT showed a greater change from the 10-min baseline (P < 0.05). Dark cycle hypoxic exposure resulted in larger percent change in breathing frequency versus the light cycle (P < 0.05). Overall, light and dark cycle pattern of breathing differences emerged along with differences between the 30-sec behavior observational method versus a predetermined time segment for baseline.
Keywords: Hypercapnia; hypoxia; hypoxic hypercapnia.
© 2019 The Authors. Physiological Reports published by Wiley Periodicals, Inc. on behalf of The Physiological Society and the American Physiological Society.
Conflict of interest statement
The authors have no conflict of interest to disclose.
Figures


Similar articles
-
The effects of restraint on ventilatory responses to hypercapnia and hypoxia in adult mice.Respir Physiol. 1998 May;112(2):215-25. doi: 10.1016/s0034-5687(98)00027-9. Respir Physiol. 1998. PMID: 9716305
-
Effect of almitrine bismesylate on breathing pattern during hypoxia/hypercapnia in rats and ferrets.Clin Exp Pharmacol Physiol. 1987 Nov-Dec;14(11-12):837-50. doi: 10.1111/j.1440-1681.1987.tb02420.x. Clin Exp Pharmacol Physiol. 1987. PMID: 2896080
-
Minute ventilation during hypoxia is augmented with capsaicin supplementation in aged mice.Respir Physiol Neurobiol. 2019 Jun;264:8-11. doi: 10.1016/j.resp.2019.03.007. Epub 2019 Mar 21. Respir Physiol Neurobiol. 2019. PMID: 30904671 Free PMC article.
-
Circadian patterns of breathing.Respir Physiol Neurobiol. 2002 Jul;131(1-2):91-100. doi: 10.1016/s1569-9048(02)00040-x. Respir Physiol Neurobiol. 2002. PMID: 12106998 Review.
-
The potential longevity-promoting hypoxic-hypercapnic environment as a measure for radioprotection.Biogerontology. 2024 Oct;25(5):891-898. doi: 10.1007/s10522-024-10129-3. Epub 2024 Aug 20. Biogerontology. 2024. PMID: 39162980 Free PMC article. Review.
Cited by
-
Measuring Breathing Patterns in Mice Using Whole-body Plethysmography.Bio Protoc. 2020 Sep 5;10(17):e3741. doi: 10.21769/BioProtoc.3741. eCollection 2020 Sep 5. Bio Protoc. 2020. PMID: 33659401 Free PMC article.
-
Influence of light/dark cycle and orexins on breathing control in green iguanas (Iguana iguana).Sci Rep. 2020 Dec 16;10(1):22105. doi: 10.1038/s41598-020-79107-2. Sci Rep. 2020. PMID: 33328521 Free PMC article.
-
A mouse model of E-cigarette or vaping product use-associated lung injury (EVALI) induced by nose-only exposure to aerosolized vitamin E acetate and associated macrophage dysfunction.Respir Res. 2025 Aug 31;26(1):263. doi: 10.1186/s12931-025-03343-1. Respir Res. 2025. PMID: 40887642 Free PMC article.
-
Breathing and Oxygen Carrying Capacity in Ts65Dn and Down Syndrome.Function (Oxf). 2023 Oct 6;4(6):zqad058. doi: 10.1093/function/zqad058. eCollection 2023. Function (Oxf). 2023. PMID: 37954975 Free PMC article.
References
-
- Aschoff, J. , and Pohl H.. 1970. Rhythmic variations in energy metabolism. Feder. Proc. 29:1541–1552. - PubMed
-
- Basso, A. , Del Bello G., Piacenza F., Giacconi R., Costarelli L., and Malavolta M.. 2016. Circadian rhythms of body temperature and locomotor activity in aging BALB/c mice: early and late life span predictors. Biogerontology 17:703–714. - PubMed
-
- Bisgard, G. E. , and Neubauer J. A.. 1995. Peripheral and central effects of hypoxia. Regul. Breathing 79:617–668.
-
- Dauger, S. , Ferkdadji L., Saumon G., Vardon G., Peuchmaur M., Gaultier C., et al. 2003. Neonatal exposure to 65% oxygen durably impairs lung architecture and breathing pattern in adult mice. Chest 123:530–538. - PubMed
Publication types
MeSH terms
Grants and funding
LinkOut - more resources
Full Text Sources
Medical

