Review
. 2020 Jan;51(1):43-61.
doi: 10.1002/jmri.26762. Epub 2019 Apr 19.

Background parenchymal enhancement on breast MRI: A comprehensive review

Affiliations
Review

Background parenchymal enhancement on breast MRI: A comprehensive review

Geraldine J Liao et al. J Magn Reson Imaging. 2020 Jan.

Abstract

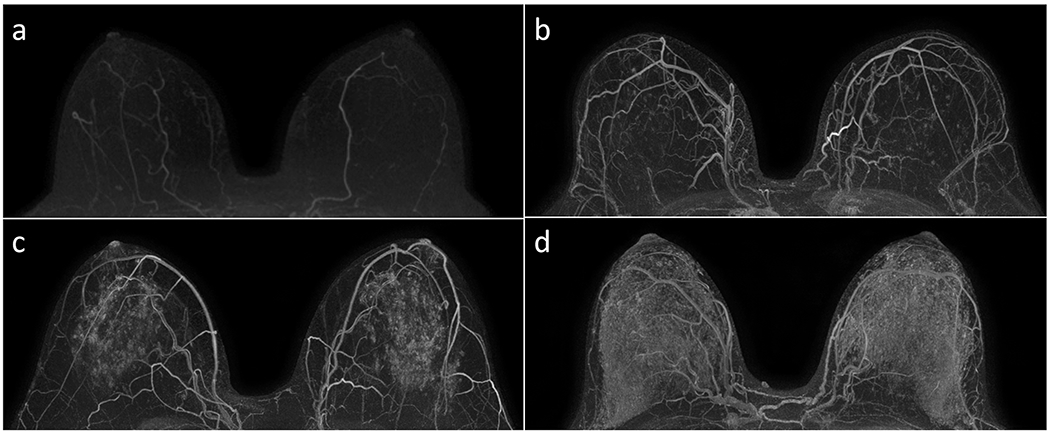
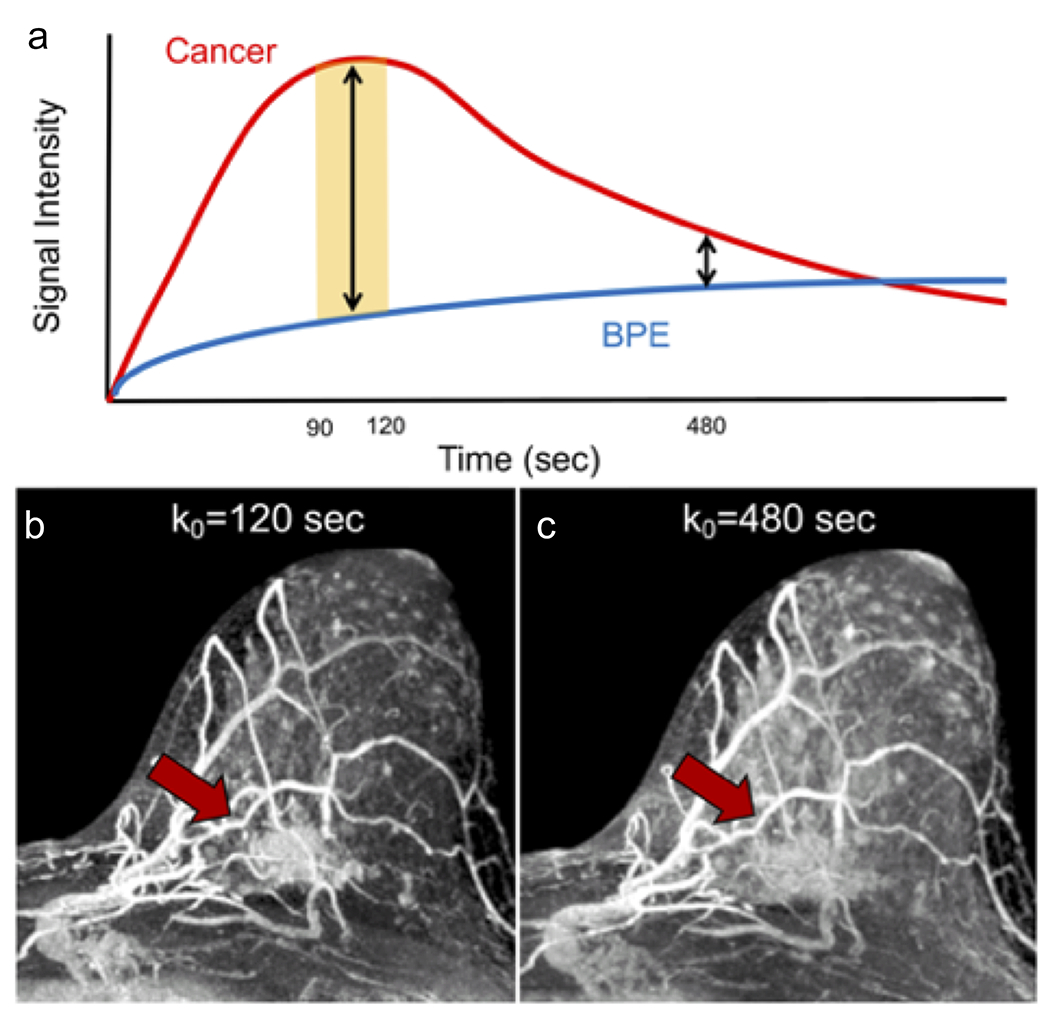
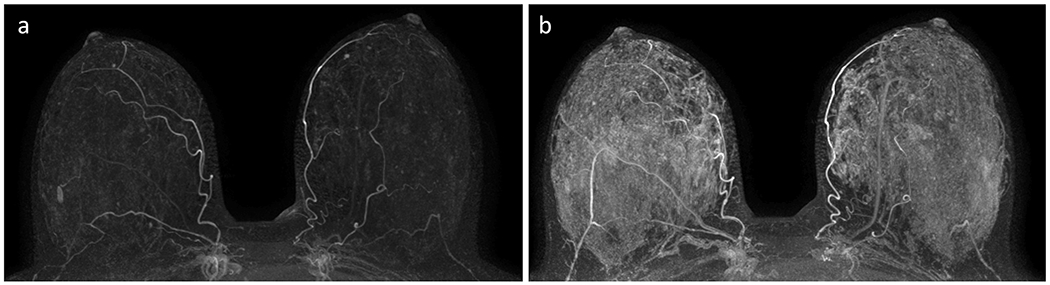
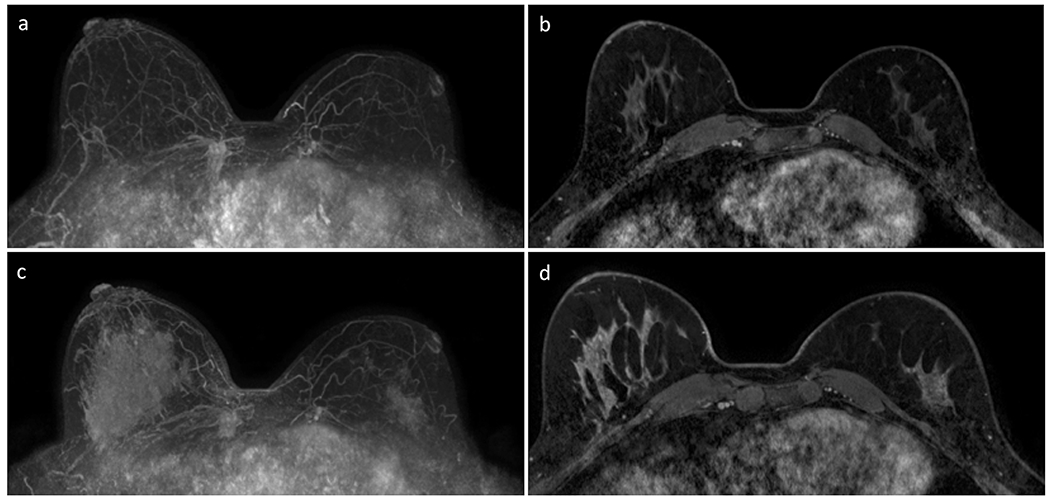
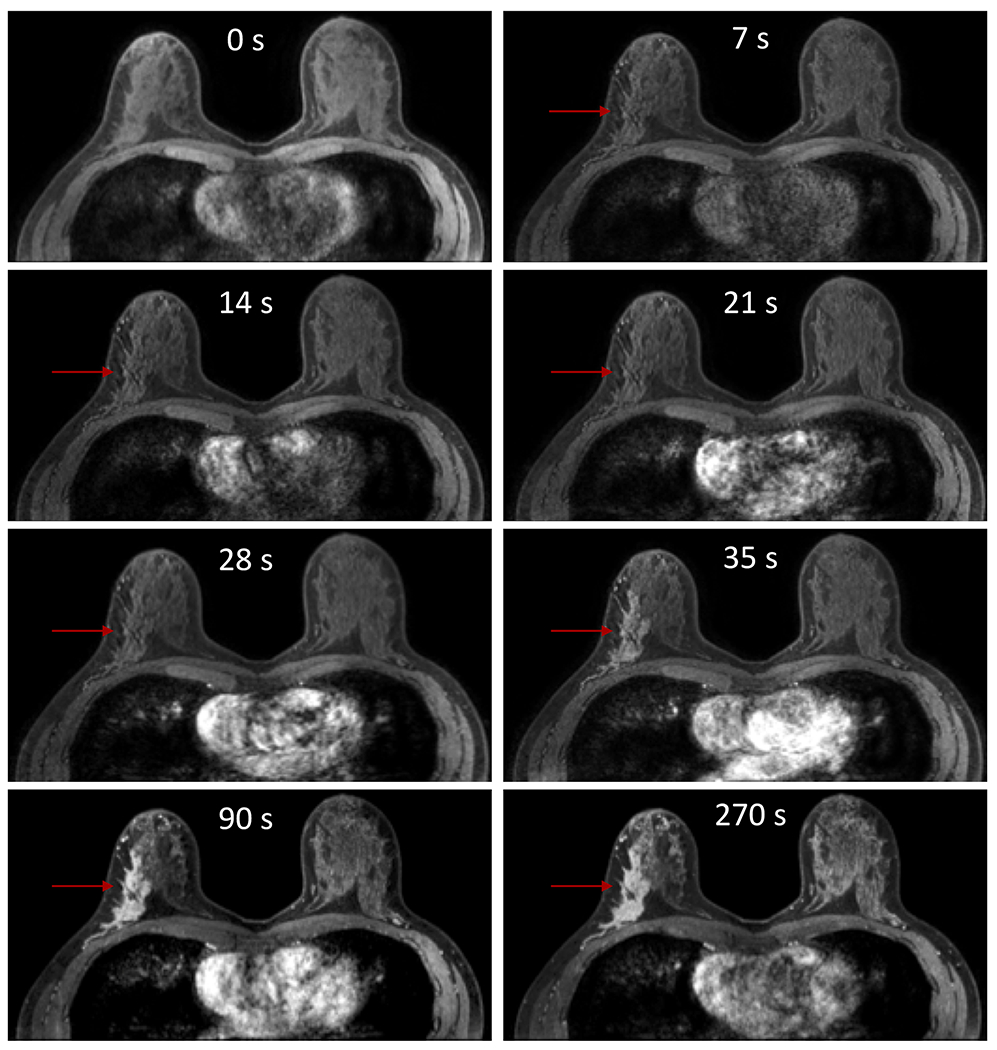
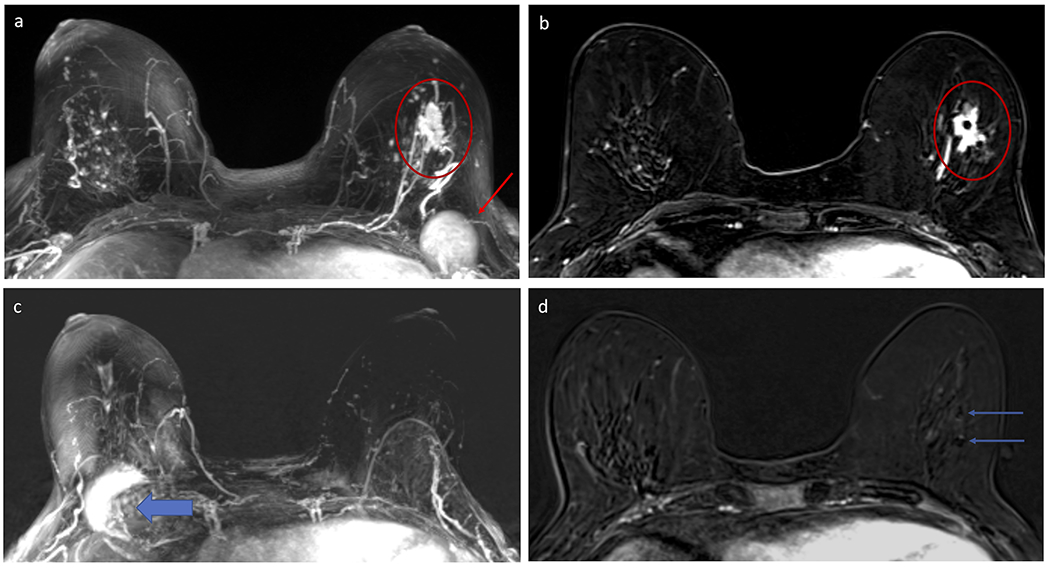
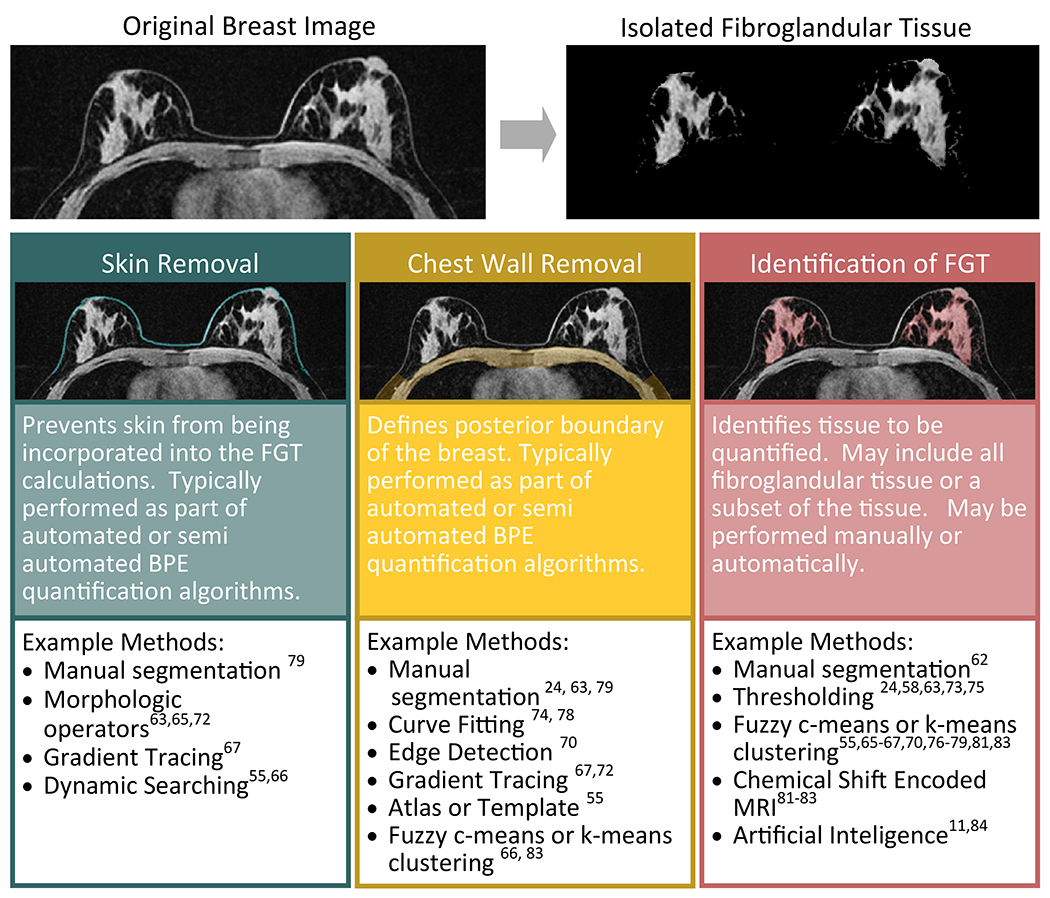
The degree of normal fibroglandular tissue that enhances on breast MRI, known as background parenchymal enhancement (BPE), was initially described as an incidental finding that could affect interpretation performance. While BPE is now established to be a physiologic phenomenon that is affected by both endogenous and exogenous hormone levels, evidence supporting the notion that BPE frequently masks breast cancers is limited. However, compelling data have emerged to suggest BPE is an independent marker of breast cancer risk and breast cancer treatment outcomes. Specifically, multiple studies have shown that elevated BPE levels, measured qualitatively or quantitatively, are associated with a greater risk of developing breast cancer. Evidence also suggests that BPE could be a predictor of neoadjuvant breast cancer treatment response and overall breast cancer treatment outcomes. These discoveries come at a time when breast cancer screening and treatment have moved toward an increased emphasis on targeted and individualized approaches, of which the identification of imaging features that can predict cancer diagnosis and treatment response is an increasingly recognized component. Historically, researchers have primarily studied quantitative tumor imaging features in pursuit of clinically useful biomarkers. However, the need to segment less well-defined areas of normal tissue for quantitative BPE measurements presents its own unique challenges. Furthermore, there is no consensus on the optimal timing on dynamic contrast-enhanced MRI for BPE quantitation. This article comprehensively reviews BPE with a particular focus on its potential to increase precision approaches to breast cancer risk assessment, diagnosis, and treatment. It also describes areas of needed future research, such as the applicability of BPE to women at average risk, the biological underpinnings of BPE, and the standardization of BPE characterization. Level of Evidence: 3 Technical Efficacy Stage: 5 J. Magn. Reson. Imaging 2020;51:43-61.

Keywords: background parenchymal enhancement; biomarkers; breast MRI; breast cancer risk; fibroglandular tissue; precision medicine.


Figures

Figure 1:
Figure 1:
Examples of qualitative BPE assessments of minimal (A), mild (B), moderate (C), and marked (D) on subtracted post-contrast maximum intensity projection images in accordance with the BI-RADS Atlas. Each case was in a unique patient, and all four MRIs revealed no suspicious enhancement in either breast.
Figure 2:
Figure 2:
Graphical and selected image timepoints from a DCE series representing the signal intensity of BPE vs. a cancer (invasive lobular carcinoma, red arrow) over time after injection of gadolinium contrast. The signal intensity time curve (A) of the cancer and BPE illustrate that the malignancy demonstrates rapid initial phase increase in signal peaking in the range of k0 = 90 to 120s (yellow shaded zone) and then decreases in signal over time (washes out) while normal tissue enhancement demonstrates slow initial phase increase in signal with persistent increase in signal. On subtracted maximum intensity projections (MIPs) of the left breast, the cancer (red arrow) is readily distinguished from the moderate BPE at time point k0 = 120s (B) but becomes less discrete at time point k0 = 480s (C), at which time the BPE has reached close to maximal signal intensity.
Figure 3:
Figure 3:
Example of varying background parenchymal enhancement (BPE) due to menstrual cycle variations in a premenopausal woman. This patient presented for a baseline screening breast MRI at age 31 (A), which demonstrated “minimal” BPE on the subtracted maximal intensity projection (MIP) and no suspicious enhancement. Two years later, subtracted MIP from a screening MRI demonstrated “marked” BPE (B) and no suspicious enhancement. This variation in BPE levels from examination to examination in the same premenopausal woman is presumed to be related to menstrual cycle variation.
Figure 4:
Figure 4:
Example of asymmetric BPE and rebound phenomenon after cessation of anti-estrogen therapy (tamoxifen) in a 41-year-old woman with history of treated left breast cancer (invasive ductal carcinoma and DCIS spanning 20 mm total) undergoing surveillance with breast MRI. Subtracted post-contrast maximum intensity projection (MIP, A) and initial phase post-contrast T1-weighted series with fat suppression (B) obtained three years after left lumpectomy and radiation therapy demonstrates asymmetric breast sizes and symmetrical minimal BPE. MIP (C) and initial phase post-contrast T1-weighted series with fat suppression (D) obtained two years later after cessation of anti-estrogen therapy demonstrates asymmetric BPE, with right breast exhibiting marked BPE and left breast showing mild BPE. The increase in BPE in both breasts is due to cessation of the anti-estrogen therapy, while the asymmetry in BPE is due to both a smaller volume of normal tissue in the left breast from prior lumpectomy as well as effects from prior radiation therapy.
Figure 5:
Figure 5:
Example of an ultrafast dynamic contrast enhanced (DCE) series of images that depicts a malignancy demonstrating much earlier enhancement than BPE, which could be useful in both discriminating a cancer from BPE and reducing false-positives. In this example using a temporal resolution of 7s for the initial early phase of MRI acquisition, the invasive lobular carcinoma in the right breast (arrow) demonstrates subtle enhancement (segmental non-mass enhancement) at 7s, 14s, 21s, and 28s while the surrounding normal breast tissue and the contralateral left breast exhibits no discernible BPE. At 35s, the malignancy is clearly enhancing and detectable, while there still remains no visually detectable BPE. At 90s and 270s, the malignancy has peaked in enhancement, but the BPE also has progressively increased. Although at these time points the malignancy is still distinct from the BPE, portions of the BPE could be mistaken for unique lesions and lead to other false-positive lesions.
Figure 6:
Figure 6:
Example of decrease in background parenchymal enhancement (BPE) in a 59 year-old woman who underwent neoadjuvant chemotherapy (NAC) for a poorly differentiated invasive ductal carcinoma (IDC) in the left breast. Subtracted maximum intensity projection (MIP) from the pre-NAC breast MRI (A) demonstrates moderate BPE in both breasts, with the left breast IDC (red circle) distinct from the BPE and an enlarged left level I axillary lymph node (red arrow) also evident. Selected post-contrast T1-weighted subtracted axial slice centered at the level of the left breast IDC demonstrates the mass with two clips within (red circle). Subtracted MIP from the post-NAC MRI performed five months later (B) demonstrates decrease in BPE, now minimal, with resolution of both the mass and axillary lymphadenopathy (note artifact on the MIP from the port-a-catheter in the right chest for chemotherapy, wide blue arrow). Patient was confirmed to have pathologic complete response (pCR) on surgery. Several papers have suggested that a reduction in BPE after NAC could help identify which patients have better clinical outcomes, including pCR.
Figure 7:
Figure 7:
Diagram of the potential steps involved in isolation of the fibroglandular tissue (FGT) for quantification of BPE. Many different approaches have been taken to isolate the FGT ranging from pure manual segmentation to fully automatic algorithms. Typical steps, illustrated here, include skin removal, chest wall removal, and final isolation of the FGT itself. These steps may be performed on a single representative slice of the breast or on the entire breast volume.

Similar articles

Cited by

References

    1. Hortobagyi GN, Connolly JL, D’Orsi CJ, et al. AJCC cancer staging manual: Breast In: Amin MB, editor. AJCC cancer staging manual. Eight edition / editor-in-chief, Amin Mahul B. ; editors, Edge Stephen B. and 16 others ; Gress Donna M. - Technical editor ; Meyer Laura R. - Managing editor. ed. Chicago IL: American Joint Committee on Cancer, Springer; 2017. p. xvii, 1024 pages.
    1. Boyd NF, Byng JW, Jong RA, et al. Quantitative classification of mammographic densities and breast cancer risk: results from the Canadian National Breast Screening Study. J Natl Cancer Inst 1995;87(9):670–675. - PubMed
    1. Boyd NF, Guo H, Martin LJ, et al. Mammographic density and the risk and detection of breast cancer. N Engl J Med 2007;356(3):227–236. - PubMed
    1. Mandelson MT, Oestreicher N, Porter PL, et al. Breast density as a predictor of mammographic detection: comparison of interval- and screen-detected cancers. J Natl Cancer Inst 2000;92(13):1081–1087. - PubMed
    1. Barlow WE, White E, Ballard-Barbash R, et al. Prospective breast cancer risk prediction model for women undergoing screening mammography. J Natl Cancer Inst 2006;98(17):1204–1214. - PubMed

Publication types

MeSH terms