The effect of the speed and range of motion of movement on the hyperemic response to passive leg movement
- PMID: 31004411
- PMCID: PMC6474844
- DOI: 10.14814/phy2.14064
The effect of the speed and range of motion of movement on the hyperemic response to passive leg movement
Abstract
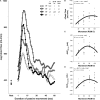
Passive leg movement (PLM)-induced hyperemia is used to assess the function of the vascular endothelium. This study sought to determine the impact of movement speed and range of motion (ROM) on the hyperemic response to PLM and determine if the currently recommended protocol of moving the leg through a 90° ROM at 180°/sec provides a peak hyperemic response to PLM. 11 healthy adults underwent multiple bouts of PLM, in which either movement speed (60-240°/sec) or ROM (30-120° knee flexion) were varied. Femoral artery blood flow (Doppler Ultrasound) and mean arterial pressure (MAP; photoplethysmography) were measured throughout. Movement speed generally exhibited positive linear relationships with the hyperemic response to PLM, eliciting ~15-20% increase in hyperemia and conductance for each 30°/sec increase in speed (P < 0.05). However, increasing the movement speed above 180°/sec was physically difficult and seemingly impractical to implement. ROM exhibited curvilinear relationships (P<0.05) with hyperemia and conductance, which peaked at 90°, such that a 30° increase or decrease in ROM from 90° resulted in a 10-40% attenuation (P < 0.05) in the hyperemic response. Alterations in the balance of antegrade and retrograde flow appear to play a role in this attenuation. Movement speed and ROM have a profound impact on PLM-induced hyperemia. When using PLM to assess vascular endothelial function, it is recommended to perform the test at the traditional 180°/sec with 90° ROM, which offers a near peak hyperemic response, while maintaining test feasibility.
Keywords: Endothelial function; exercise blood flow; movement speed; passive leg movement; range of motion.
© 2019 The Authors. Physiological Reports published by Wiley Periodicals, Inc. on behalf of The Physiological Society and the American Physiological Society.
Conflict of interest statement
The authors have no conflicts of interest to report.
Figures


Similar articles
-
The role of the endothelium in the hyperemic response to passive leg movement: looking beyond nitric oxide.Am J Physiol Heart Circ Physiol. 2021 Feb 1;320(2):H668-H678. doi: 10.1152/ajpheart.00784.2020. Epub 2020 Dec 11. Am J Physiol Heart Circ Physiol. 2021. PMID: 33306447 Free PMC article.
-
Delineating the age-related attenuation of vascular function: Evidence supporting the efficacy of the single passive leg movement as a screening tool.J Appl Physiol (1985). 2019 Jun 1;126(6):1525-1532. doi: 10.1152/japplphysiol.01084.2018. Epub 2019 Apr 4. J Appl Physiol (1985). 2019. PMID: 30946637 Free PMC article.
-
Single passive leg movement-induced hyperemia: a simple vascular function assessment without a chronotropic response.J Appl Physiol (1985). 2017 Jan 1;122(1):28-37. doi: 10.1152/japplphysiol.00806.2016. Epub 2016 Nov 10. J Appl Physiol (1985). 2017. PMID: 27834672 Free PMC article.
-
CORP: Ultrasound assessment of vascular function with the passive leg movement technique.J Appl Physiol (1985). 2017 Dec 1;123(6):1708-1720. doi: 10.1152/japplphysiol.00557.2017. Epub 2017 Sep 7. J Appl Physiol (1985). 2017. PMID: 28883048 Free PMC article. Review.
-
Physiological Impact and Clinical Relevance of Passive Exercise/Movement.Sports Med. 2019 Sep;49(9):1365-1381. doi: 10.1007/s40279-019-01146-1. Sports Med. 2019. PMID: 31264182 Free PMC article. Review.
Cited by
-
Acute effect of passive one-legged intermittent static stretching on regional blood flow in young men.Eur J Appl Physiol. 2021 Jan;121(1):331-337. doi: 10.1007/s00421-020-04524-0. Epub 2020 Oct 20. Eur J Appl Physiol. 2021. PMID: 33079234
-
Indices of leg resistance artery function are independently related to cycling V̇O2 max.Physiol Rep. 2020 Aug;8(16):e14551. doi: 10.14814/phy2.14551. Physiol Rep. 2020. PMID: 32812353 Free PMC article.
-
Impact of Interrepetition Rest on Muscle Blood Flow and Exercise Tolerance during Resistance Exercise.Medicina (Kaunas). 2022 Jun 18;58(6):822. doi: 10.3390/medicina58060822. Medicina (Kaunas). 2022. PMID: 35744085 Free PMC article.
References
Publication types
MeSH terms
LinkOut - more resources
Full Text Sources

