. 2019:23:101823.
doi: 10.1016/j.nicl.2019.101823. Epub 2019 Apr 10.

Longitudinal tau-PET uptake and atrophy in atypical Alzheimer's disease

Affiliations

Longitudinal tau-PET uptake and atrophy in atypical Alzheimer's disease

Irene Sintini et al. Neuroimage Clin. 2019.

Abstract

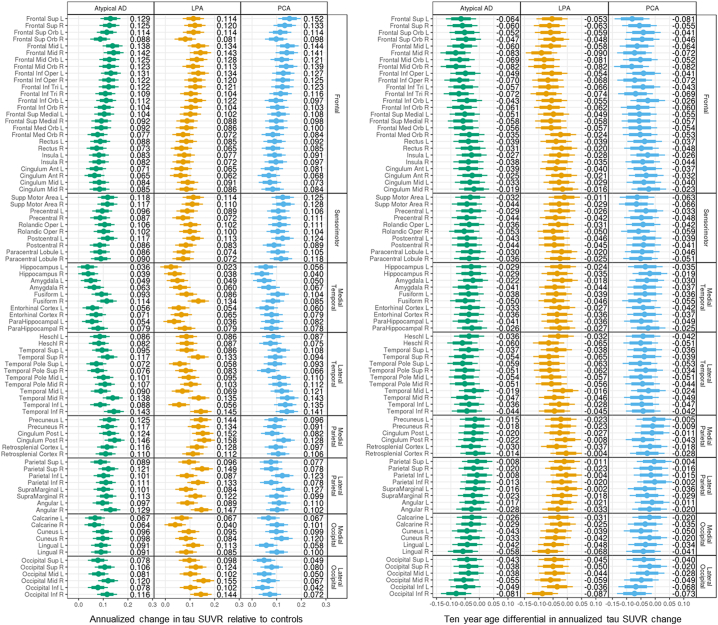
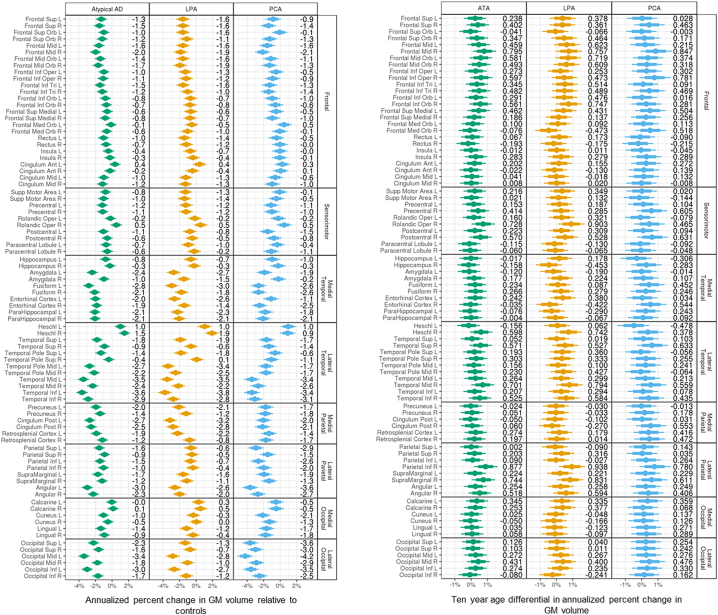
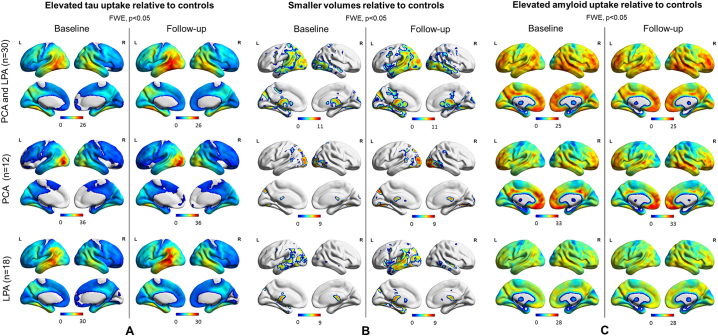
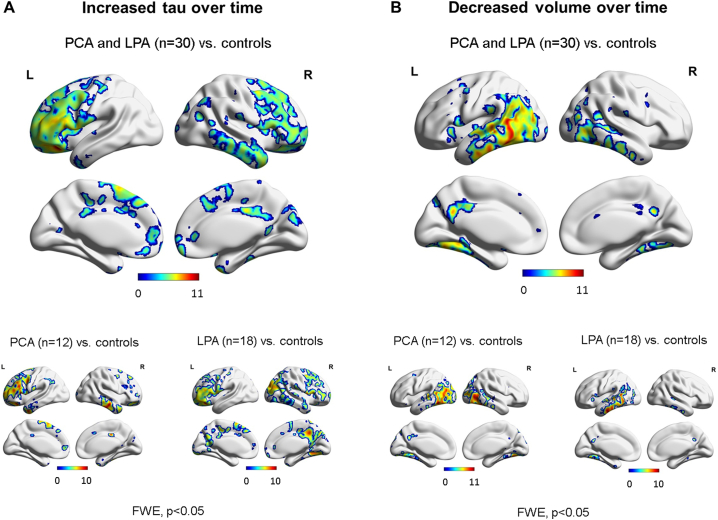
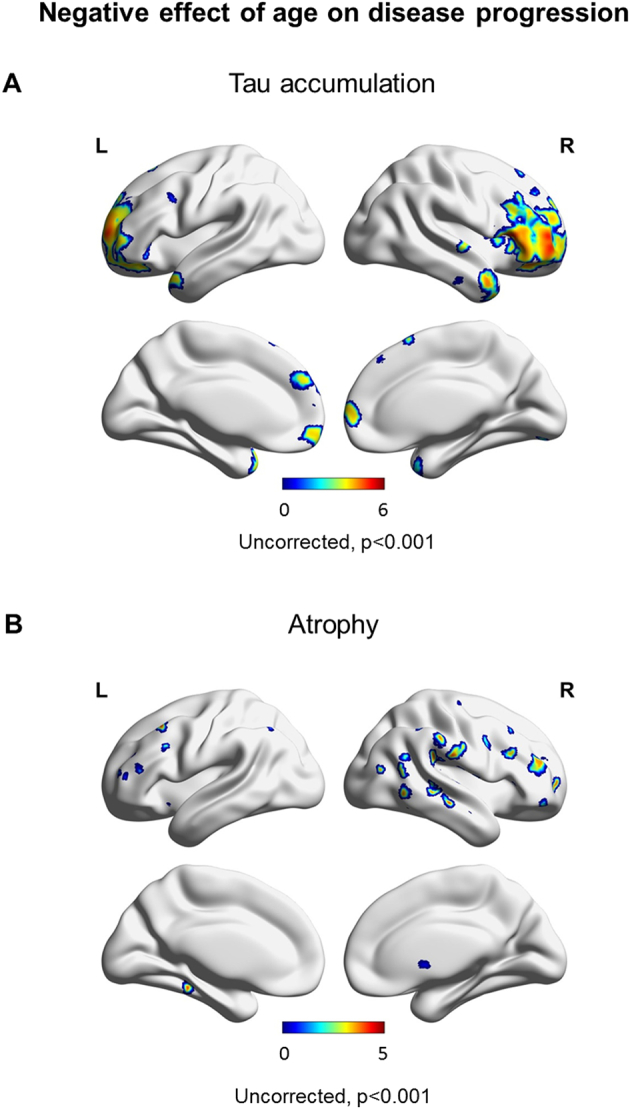
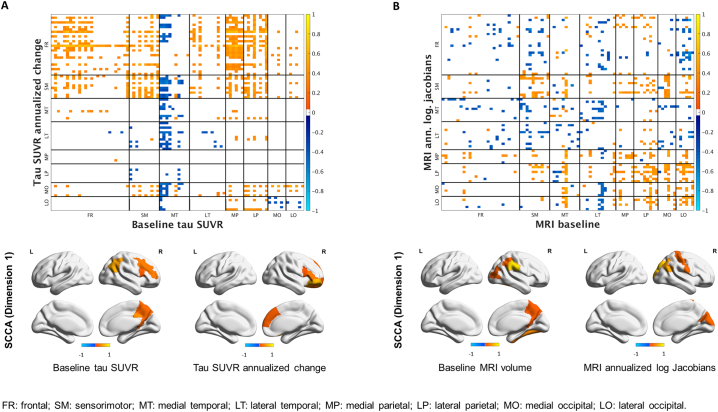
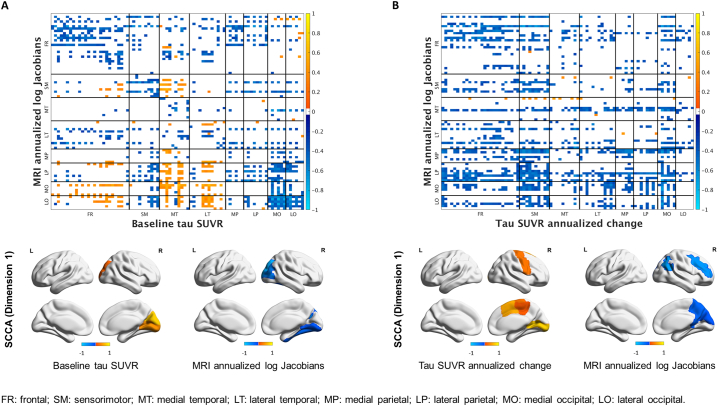
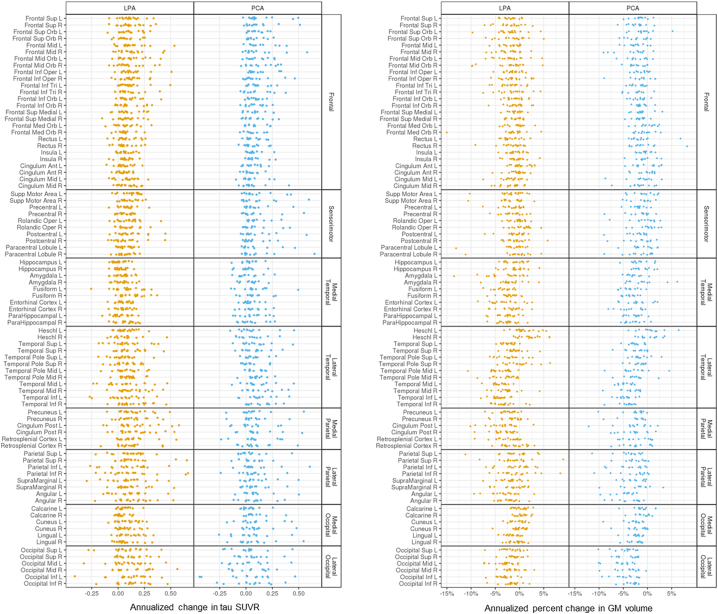
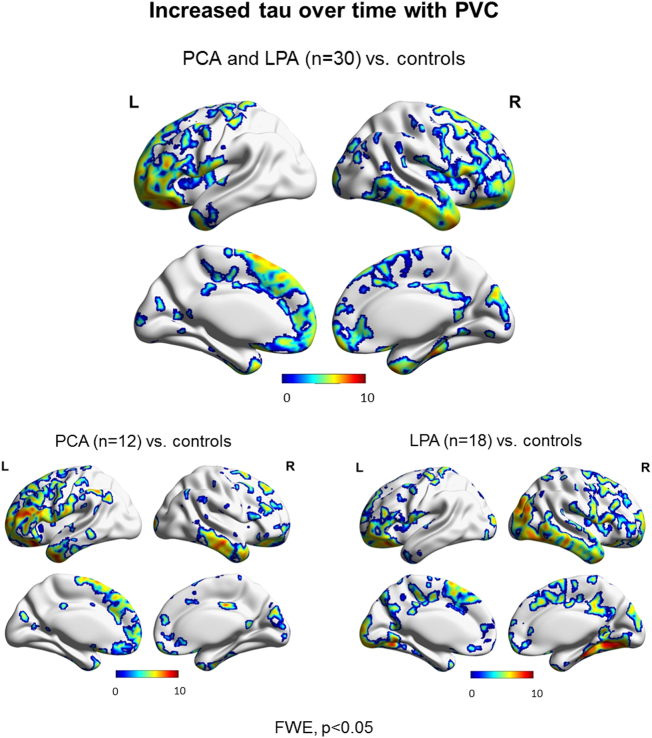
The aims of this study were: to examine regional rates of change in tau-PET uptake and grey matter volume in atypical Alzheimer's disease (AD); to investigate the role of age in such changes; to describe multimodal regional relationships between tau accumulation and atrophy. Thirty atypical AD patients underwent baseline and one-year follow-up MRI, [18F]AV-1451 PET and PiB PET. Region- and voxel-level rates of tau accumulation and grey matter atrophy relative to cognitively unimpaired individuals, and the influence of age on such rates, were assessed. Univariate and multivariate analyses were performed between baseline measurements and rates of change, between baseline tau and atrophy, and between the two rates of change. Regional patterns of change in tau and volume differed, with highest rates of tau accumulation in frontal lobe and highest rates of atrophy in temporoparietal regions. Age had a negative effect on disease progression, predominantly on tau, with younger patients having a more rapid accumulation. Baseline tau uptake and regions of tau accumulation were disconnected, with high baseline tau uptake across the cortex correlated with high rates of tau accumulation in frontal and sensorimotor regions. In contrast, baseline volume and atrophy were locally related in the occipitoparietal regions. Higher tau uptake at baseline was locally related to higher rates of atrophy in frontal and occipital lobes. Tau accumulation rates positively correlated with rates of atrophy. In summary, our study showed that tau accumulation and atrophy presented different regional patterns in atypical AD, with tau spreading into the frontal lobes while atrophy remains in temporoparietal and occipital cortex, suggesting a temporal disconnect between protein deposition and neurodegeneration.

Keywords: Atrophy; Atypical AD; Longitudinal tau-PET; Multimodal imaging.


Figures

Fig. 1
Fig. 1
Median and distribution estimates of regional annualized changes in tau SUVR. Bars cover 80% (thick bar) to 95% (thin bar) intervals of posterior estimates (i.e. confidence intervals). Regional decade effects (i.e. how the regional change relates to age) are showed on the right.
Fig. 2
Fig. 2
Median and distribution estimates of regional annualized percent changes in MRI grey matter (GM) volumes. Bars cover 80% (thick bar) to 95% (thin bar) intervals of posterior estimates (i.e. confidence intervals). Regional decade effects (i.e. how the regional change relates to age) are showed on the right.
Fig. 3
Fig. 3
SPM maps of increased tau-PET uptake (A), decreased MRI grey matter volume (B) and increased Aβ-PET uptake (C) at baseline and follow-up for the entire cohort and for the two disease variants relative to cognitively unimpaired. Results are shown after FWE correction for multiple comparison at p < 0.05.
Fig. 4
Fig. 4
SPM maps of annualized change in tau-PET uptake (A) and MRI annualized log Jacobians (B) for the entire patient cohort (top) and for the two disease variants (bottom) relative to cognitively unimpaired. Results are shown after FWE correction for multiple comparison at p < 0.05.
Fig. 5
Fig. 5
SPM maps of the effect of age on the annualized change in tau-PET uptake (A) and on the MRI annualized log Jacobians (B). Younger patients experienced faster tau accumulation and volume loss than older patients. Results are shown uncorrected at p < 0.001.
Fig. 6
Fig. 6
Pearson's correlations (top) and SCCA (bottom) between baseline tau SUVR and tau SUVR annualized changes (A) and between baseline MRI volumes and MRI annualized log Jacobians (B).
Fig. 7
Fig. 7
Pearson's correlations (top) and SCCA (bottom) between baseline tau SUVR and MRI annualized log Jacobians (A) and between tau SUVR annualized changes and MRI annualized log Jacobians (B).
Supplemental Fig. 1
Supplemental Fig. 1
Regional annualized changes in tau SUVR (left) and regional annualized percent changes in MRI grey matter (GM) volumes (right) for each patient.
Supplemental Fig. 2
Supplemental Fig. 2
SPM maps of annualized change in tau-PET uptake from partial-volume corrected images for the entire patient cohort (top) and for the two disease variants (bottom) relative to cognitively unimpaired. Results are shown after FWE correction for multiple comparison at p < 0.05.

References

    1. Adams J.N., Lockhart S.N., Li L., Jagust W.J. Relationships between tau and glucose metabolism reflect Alzheimer's disease pathology in cognitively normal older adults. Cereb. Cortex. May 2019;29(5):1997–2009. - PMC - PubMed
    1. Ahmed Z., Cooper J., Murray T.K., Garn K., McNaughton E., Clarke H.…O'Neill M.J. A novel in vivo model of tau propagation with rapid and progressive neurofibrillary tangle pathology: the pattern of spread is determined by connectivity, not proximity. Acta Neuropathol. 2014;127(5):667–683. - PMC - PubMed
    1. Ashburner J., Friston K.J. Unified segmentation. Neuroimage. 2005;26(3):839–851. - PubMed
    1. Avants B.B., Epstein C.L., Grossman M., Gee J.C. Symmetric diffeomorphic image registration with cross-correlation: evaluating automated labeling of elderly and neurodegenerative brain. Med. Image Anal. 2008;12(1):26–41. - PMC - PubMed
    1. Avants B.B., Cook P.A., Ungar L., Gee J.C., Grossman M. Dementia induces correlated reductions in white matter integrity and cortical thickness: a multivariate neuroimaging study with sparse canonical correlation analysis. Neuroimage. 2010;50(3):1004–1016. - PMC - PubMed

Publication types