. 2019 Jun:24:101195.
doi: 10.1016/j.redox.2019.101195. Epub 2019 Apr 11.

Inhibition of Brd4 alleviates renal ischemia/reperfusion injury-induced apoptosis and endoplasmic reticulum stress by blocking FoxO4-mediated oxidative stress

Affiliations

Inhibition of Brd4 alleviates renal ischemia/reperfusion injury-induced apoptosis and endoplasmic reticulum stress by blocking FoxO4-mediated oxidative stress

Hao Liu et al. Redox Biol. 2019 Jun.

Abstract

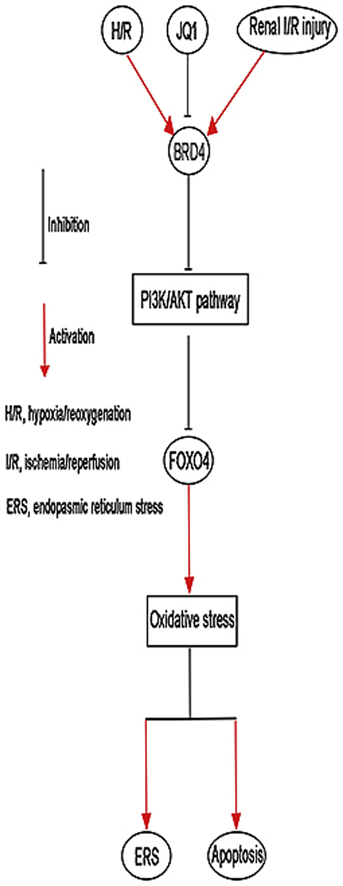
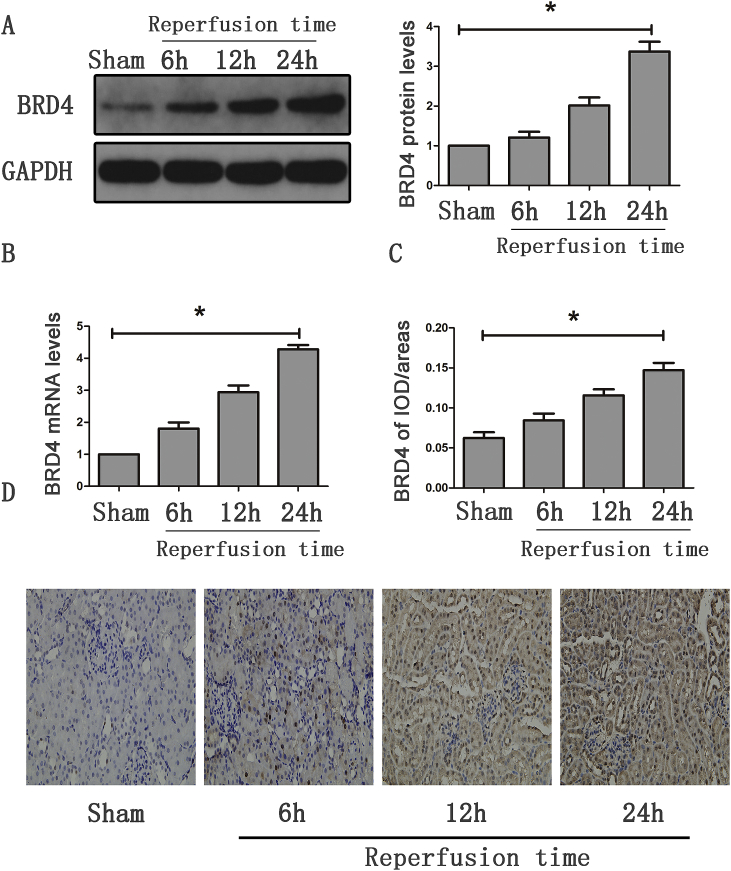
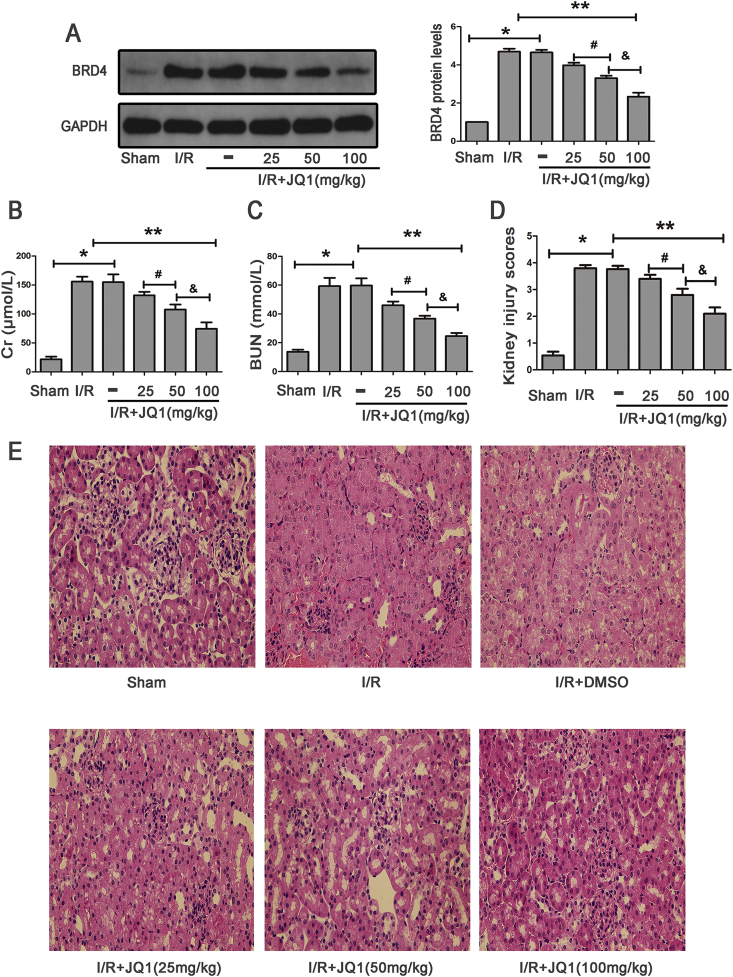
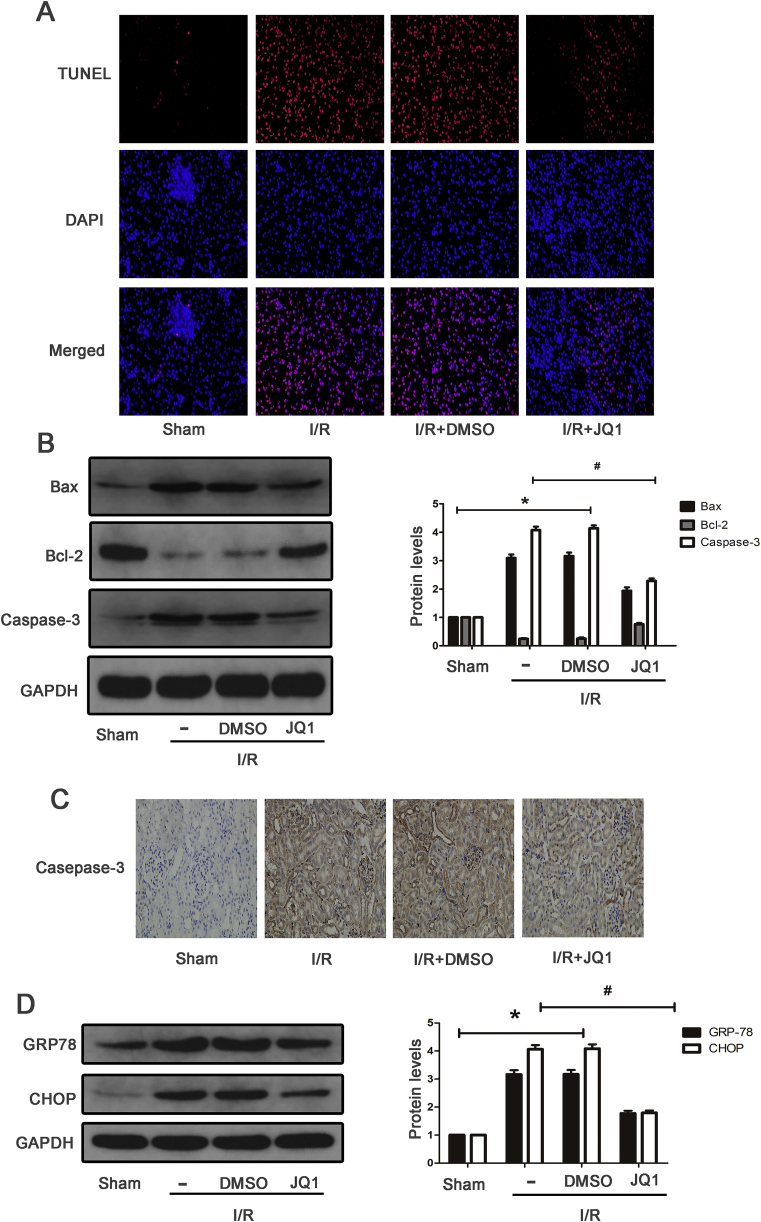
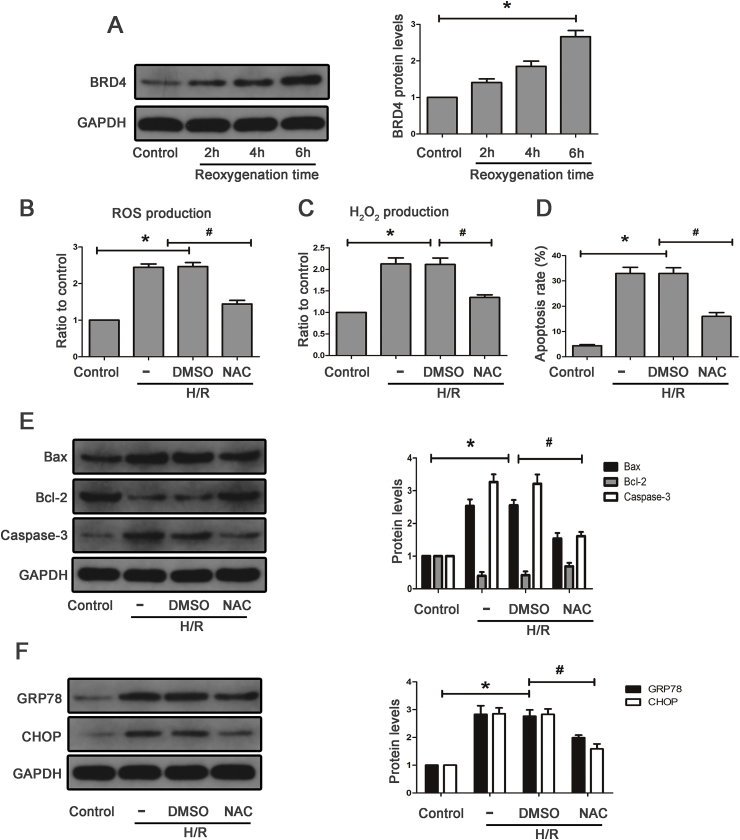
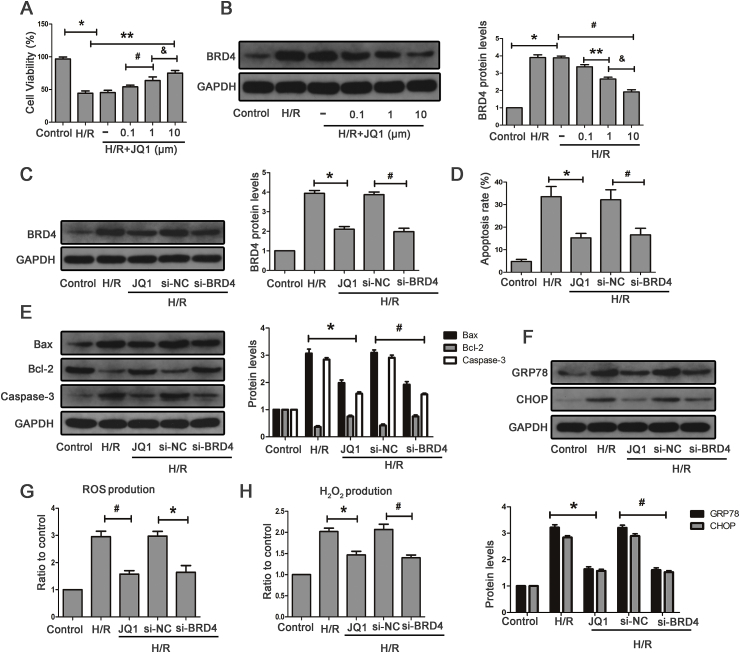
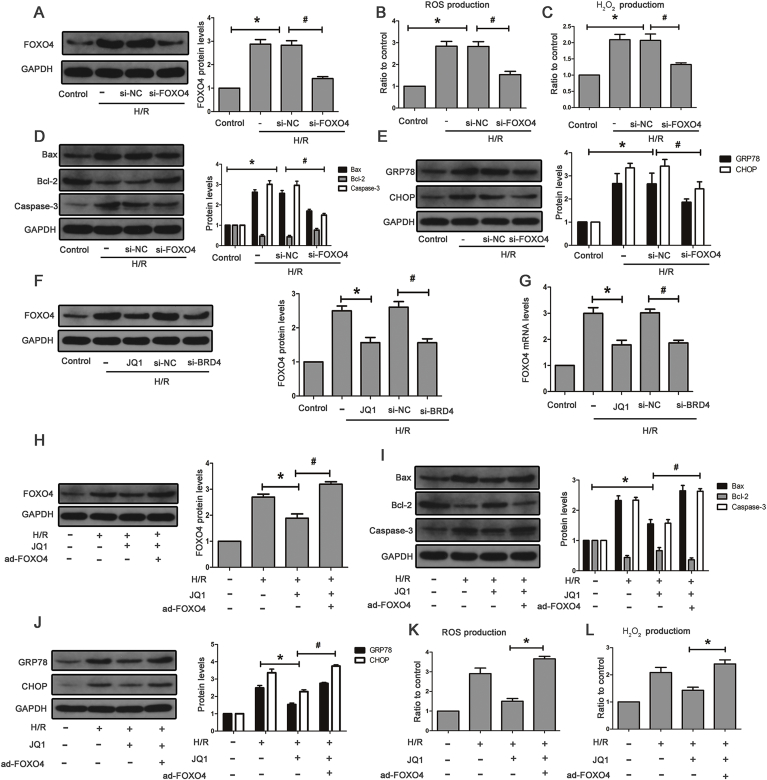
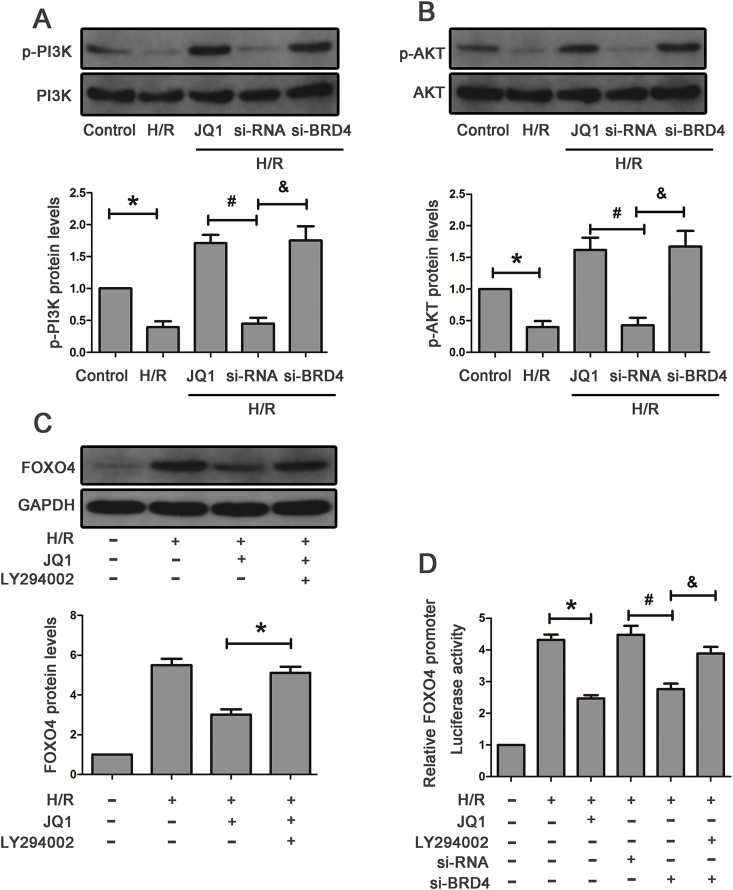
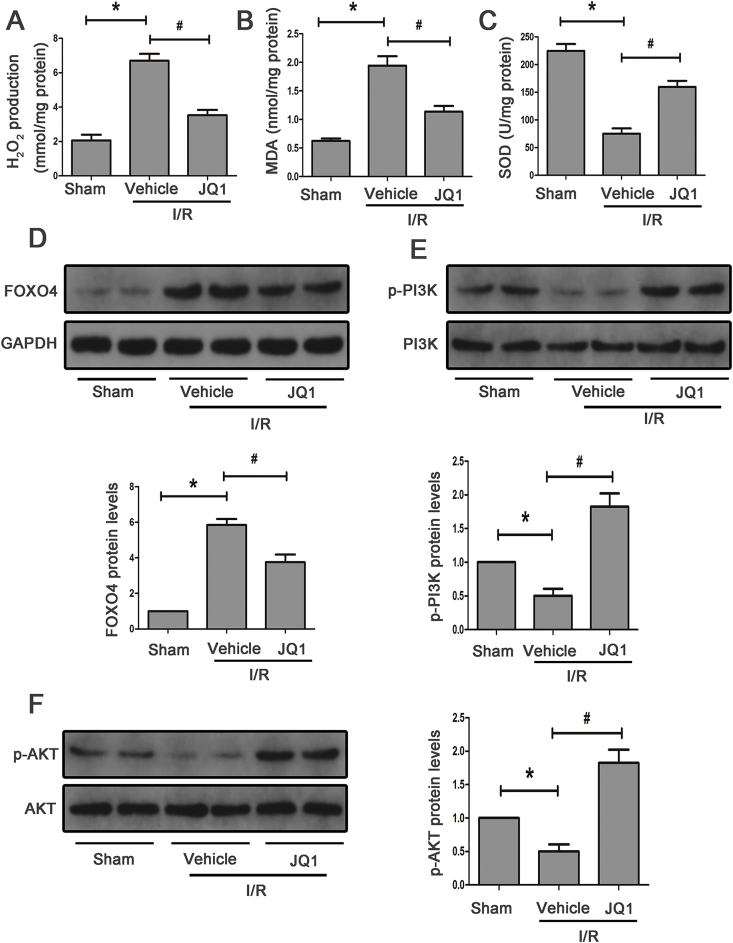
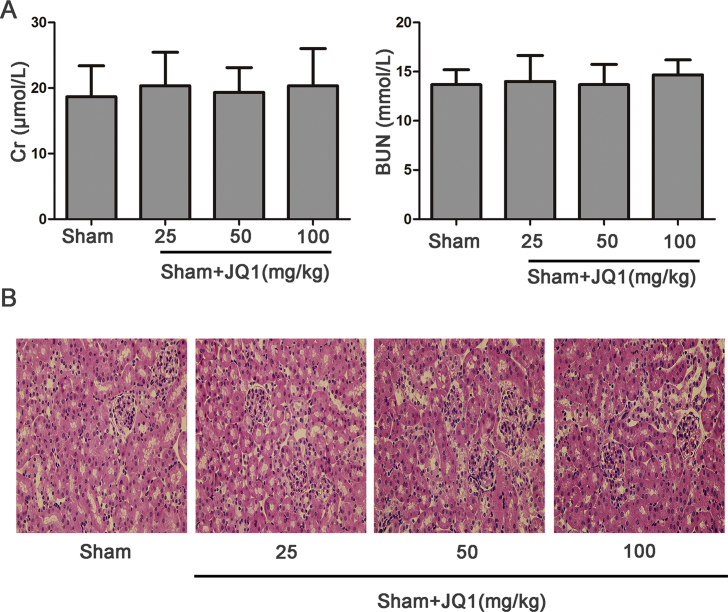
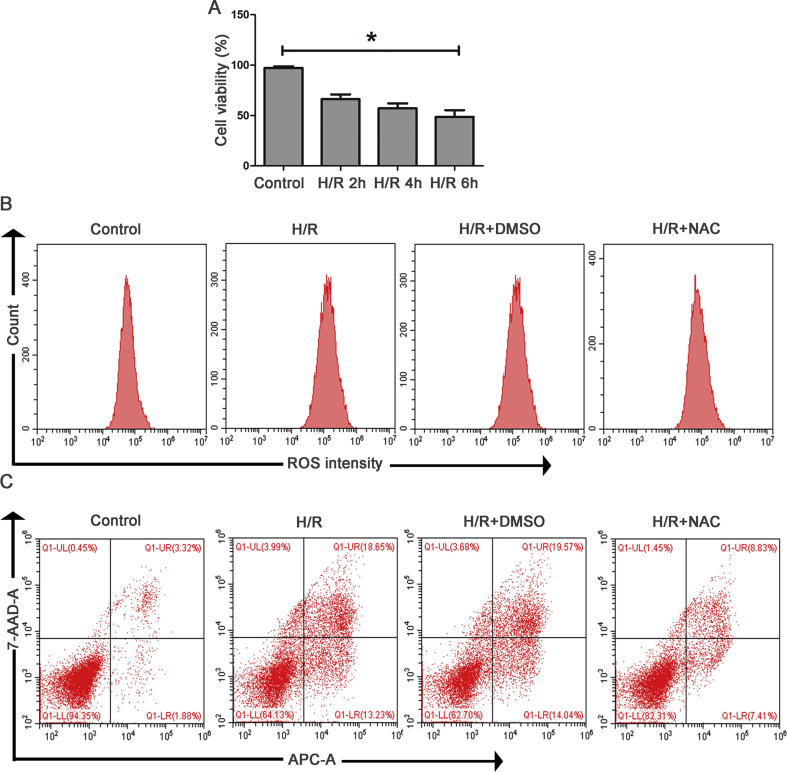
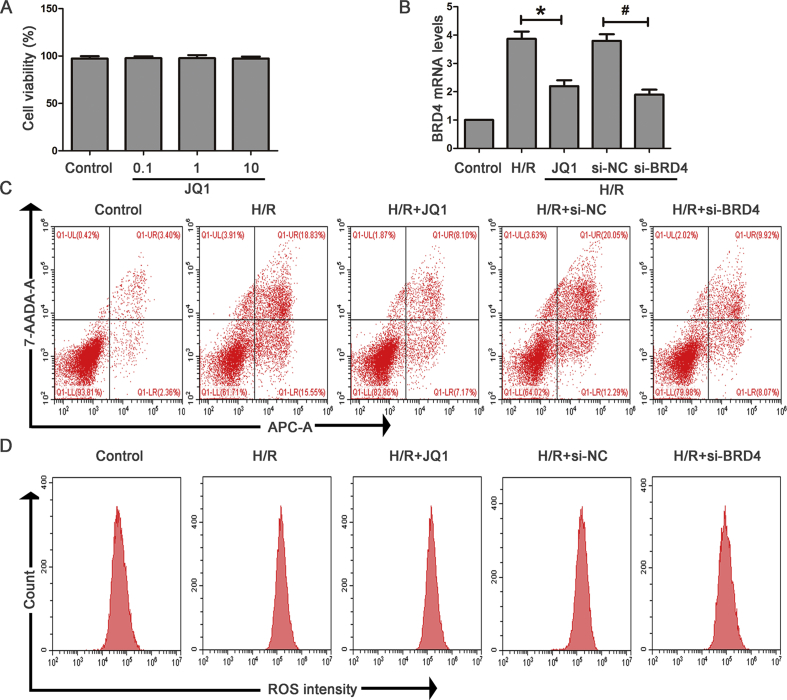
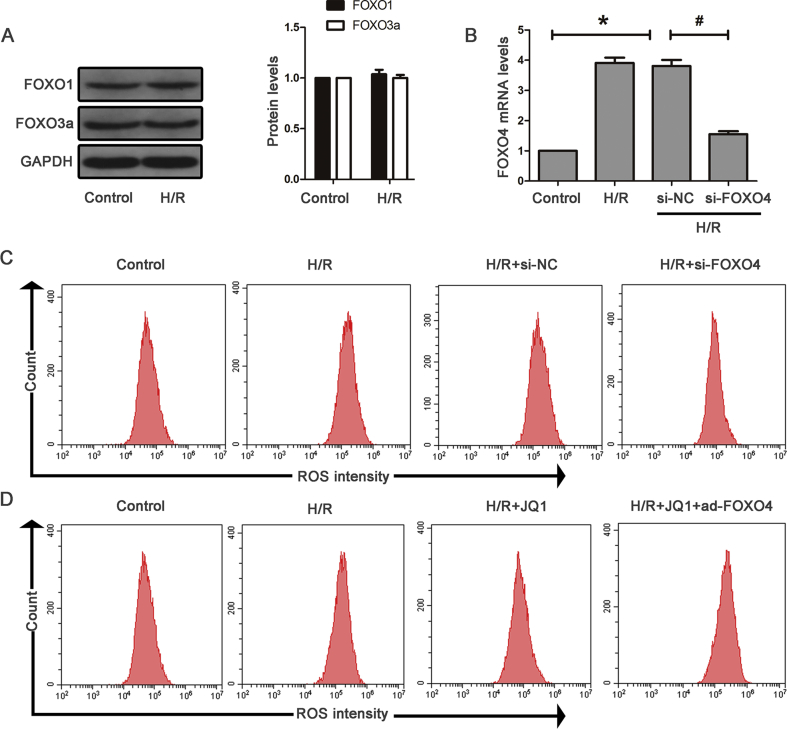
Ischemia/reperfusion injury (I/R) is one of the leading causes of acute kidney injury (AKI) that typically occurs in renal surgeries. However, renal I/R still currently lacks effective therapeutic targets. In this study, we proved that inhibition of Brd4 with its selective inhibitor, JQ1, could exert a protective role in renal I/R injury in mice. Inhibiting Brd4 with either JQ1 or genetic knockdown resulted in reduction of endoplasmic reticulum stress (ERS)-associated protein and proapoptotic protein expression both in I/R-induced injury and hypoxia/reoxygenation (H/R) stimulation in HK-2 cells. H/R-induced apoptosis and ERS depended on oxidative stress in vitro. Moreover, FoxO4, which is involved in the generation of hydrogen peroxide, was up-regulated during H/R stimulation-mediated apoptosis and ERS, and this upregulation could be abolished by Brd4 inhibition. Consistently, FoxO4-mediated ROS generation was attenuated upon inhibition of Brd4 with JQ1 or siRNA against Brd4. Further, the transcriptional activity of FoxO4 was suppressed by PI3K and AKT phosphorylation, which are upstream signals of FoxO4 expression, and were enhanced by Brd4 both in vivo and in vitro. In conclusion, our results proved that Brd4 inhibition blocked renal apoptotic and ERS protein expression by preventing FoxO4-dependent ROS generation through the PI3K/AKT pathway, indicating that Brd4 could be a potential therapeutic target for renal I/R injury.

Keywords: Apoptosis; Brd4; ERS; Oxidative stress; Renal I/R injury.


Figures

Image 1
Graphical abstract
Fig. 1
Fig. 1
Brd4 was up-regulated in the kidney after mice were suffered from IRI. (A) Brd4 protein levels were detected by western blotting analysis at various reperfusion time points, such as 6 h, 12 h, and 24 h, and bar graph showing the fold changes of Brd4 relative to sham group from three independent samples. (B) Brd4 mRNA levels were detected by real-time RT-PCR at 6 h, 12 h, 24 h of reperfusion time. (C–D) Bar graph showing the fold changes of Brd4 positive areas relative to sham group, and immunohistochemical staining of Brd4 in renal tissues at 6 h, 12 h, 24 h of reperfusion time. Values are expressed as the mean ± SEM. *P < 0.05, relative to the sham group, n = 3.
Fig. 2
Fig. 2
JQ1 treatment protected kidney against I/R. (A) Western blots of Brd4 protein expression after treatment of mice with JQ1 at doses of 25 mg/kg, 50 mg/kg, 100 mg/kg, and bar graph showing the fold changes of Brd4 relative to sham group from three independent samples. (B–C) Protective effect of JQ1 at doses of 25 mg/kg, 50 mg/kg, 100 mg/kg on renal function of mice exposed to renal IRI. (D–E) Protective effect of JQ1 at various doses of 25 mg/kg, 50 mg/kg, 100 mg/kg on renal tissue damage detected by H&E (×400), and randomly selected image fields from eight independent kidney samples were used for quantification renal tubular injury scores. Values are expressed as the mean ± SEM. *P < 0.05, relative to sham group; **P < 0.05, relative to vehicle control; #P < 0.05, relative to I/R+JQ1 (25 mg/kg); & P < 0.05, relative to I/R+JQ1 (50 mg/kg).
Fig. 3
Fig. 3
JQ1 inhibited apoptosis and ERS induced by renal IRI in mice. (A) Representative images of TUNEL staining on kidney sections (×400). (B) Western blots of Bax,Bcl-2, Caspse-3 at 24 h of reperfusion time, and bar graph showing the fold changes of Bax,Bcl-2, Caspse-3 relative to sham group from three independent samples. (C) Immunohistochemical staining of Caspse-3 in renal tissues at 24 h of reperfusion time. (D) Western blots of GRP78, CHOP at 24 h of reperfusion time, and bar graph showing the fold changes of GRP78, CHOP. Values are expressed as the mean ± SEM. *P < 0.05, relative to sham group; #P < 0.05, relative to vehicle control.
Fig. 4
Fig. 4
Oxidative mediated apoptosis and ERS in a H/R cell model. HK-2 cells were pretreated with 5 mM N-acetyl-cysteine (NAC) for 1 h, and then subjected to H/R. (A) Brd4 protein levels were detected by western blot analysis at various reoxygenation time, including 2 h, 4 h, and 6 h, and bar graph showing the fold changes of Brd4 relative to sham group from three independent samples. (B–C) ROS and H2O2 production were measured and bar graph quantification of ROS accumulation from three independent experiments. (D) Apoptotic rates of normal cells and cells exposed to H/R were detected and bar graphs represent three independent experiments, each performed in triplicates. (E) Western blot analysis for the protein expression of Bax, BCL-2, caspase-3, and protein levels were quantified by densitometry and normalized to the expression of GAPDH from three independent experiments. (F) Western blot analysis for the protein expression of GRP78, CHOP, and protein levels were quantified by densitometry and normalized to the expression of GAPDH from three independent experiments. Values are expressed as the mean ± SEM. *P < 0.05, relative to control group; #P < 0.05, relative to the H/R+DMSO.
Fig. 5
Fig. 5
JQ1 alleviated oxidative stress, apoptosis and ERS in vitro. (A–B) HK-2 cells were pretreated with or without JQ1 at different doses (0.1, 1, 10 μM) for 1 h, and then were exposed to H/R. (A) Effect of JQ1 with different concentrations on cell viability detected by CCK8 upon H/R stimulation in the indicated groups, and (B) representative bands of Western blot analysis for the expression of Brd4 and bar graph quantification as indicated from three independent experiments, Values are expressed as the mean ± SEM; *P < 0.05, relative to control; **P < 0.05, relative to H/R+DMSO; #P < 0.05, relative to H/R+JQ1 (0.1 μM); & P < 0.05, relative to H/R+JQ1 (1 μM). (C–G) HK-2 cells were transfected with a siRNA against Brd4 or a negative control siRNA (si-NC) for 48 h and were pretreated with or without JQ1 at dose of 10 μM for 1 h before being exposed to H/R. (C) Representative bands of Western blot analysis for the expression of Brd4 and bar graph quantification as indicated from three independent experiments. (D) Apoptotic cells exposed to H/R were detected by flow cytometry, and bar graphs represent three independent experiments, each performed in triplicates. (E) Representative Western blot analysis of Bax, Bcl-2, Caspase-3 and bar graphs from three independent experiments, each performed in triplicates. (F) Representative bands of Western blot analysis for the expression of GRP78 and CHOP, and bar graphs from three independent experiments. (G–H) ROS production was measured by flow cytometry and bar graph showed the quantification of ROS in the indicated groups from three independent experiments, and H2O2 production measured by Amplex Red in HK-2 cells, and bar graphs represent three independent experiments, each performed in triplicates. Values are expressed as the mean ± SEM; *P < 0.05, relative to H/R group; #P < 0.05, relative to H/R+si-NC.
Fig. 6
Fig. 6
Brd4 inhibition ameliorated apoptosis and ERS through FoxO4. (A) Representative bands of Western blot analysis for the expression of FoxO4 and bar graphs from three independent experiments. (B–C) ROS production measured by flow cytometry in the indicated groups from three independent experiments and bar graph showing the of quantification ROS, and H2O2 production measured by Amplex Red in HK-2 cells, and bar graphs represent three independent experiments, each performed in triplicates. (D) Western Blot analysis for the protein expression of Bax, Bcl-2, Caspase-3 and bar graph quantification as indicated from three independent experiments. (E) Western Blot analysis for the protein expression of GRP78 and CHOP, and bar graph quantification as indicated from three independent experiments. Values are expressed as the mean ± SEM; *P < 0.05, relative to control; #P < 0.05, relative to H/R+si-NC. (F) Western Blot analysis for the protein expression of FoxO4, and bar graphs represent three independent experiments. (G) FoxO4 mRNA levels were detected by real-time RT-PCR and bar graph quantification as indicated from three independent experiments, *P < 0.05, relative to H/R; #P < 0.05, relative to H/R+si-NC. (H–L) HK-2 cells were pretreated with JQ1 (10 μm) for 1 h before H/R model established, and HK-2 cells were infected with adenovirus carrying the human FoxO4 for 48 h before being exposed to H/R. (H) Representative Western blot analysis of FoxO4 in the indicated groups. (I) Representative Western blot analysis of Bax, Bcl-2, Caspase-3 in the indicated groups. (J) Western blot analysis for the protein expression of GRP78 and CHOP in the indicated groups. (K–L) ROS and H2O2 production were measured. Values are expressed as the mean ± SEM; *P < 0.05 versus H/R+JQ1.
Fig. 7
Fig. 7
Brd4 regulated FoxO4 expression via the PI3K/AKT pathway. (A–B) Western blot analysis for the protein expression of PI3K, p-PI3K, AKT, p-AKT in the indicated groups and quantitative analysis of p-PI3K and p-AKT. *P < 0.05 versus control, #P < 0.05 versus H/R+JQ1, & P < 0.05 versus H/R+si-NC. (C–D) HK-2 cells were pretreated with JQ1 (10 μM) for 1 h following treatment with LY294002 (PI3K inhibitor, 20 μM) and then exposed to H/R. (C) Western blot analysis for the protein expression of FoxO4 in the indicated groups and quantification, *P < 0.05 versus H/R+JQ1. (D) Luciferase assay of FoxO4 promoter activity in the presence of JQ1 or Brd4 knockdown with siRNA or combination of JQ1 and LY294002 from three independent experiments, each performed in six replicates. *P < 0.05 versus H/R, #P < 0.05 versus H/R+si-NC, & P < 0.05 versus H/R+si-Brd4.
Fig. 8
Fig. 8
JQ1 attenuated FoxO4-mediated oxidative stress via the PI3K/AKT pathway in mice. (A–C) MDA, SOD and H2O2 production in mice subjected to I/R with or without JQ1. (D) Western blot analysis for the protein expression of FoxO4 in mice treated with or without JQ1 at 24 h of reperfusion time and quantification. (E–F) Western blot analysis for the protein expression of PI3K, p-PI3K, AKT, p-AKT with or without JQ1 at 24 h of reperfusion time and quantification. *P < 0.05 versus Sham, #P < 0.05 versus I/R.
Fig. S1
Fig. S1
(A) Effect of JQ1 at doses of 25 mg/kg, 50 mg/kg, 100 mg/kg on renal fuction of mice exposed to Sham operation. (B) Effect of JQ1 at various doses of 25 mg/kg, 50 mg/kg, 100 mg/kg on renal tissue damage detected by H&E (×400).
Fig. S2
Fig. S2
(A) Effect of different reoxygenation time (2h, 4h, 6h) on cell viability detected by CCK8, *P versus control. (B) ROS production was measured by flow cytometry. (C) Cell apoptosis was evaluated using flow cytometry.
Fig. S3
Fig. S3
(A) Effect of JQ1 at doses of 0.1, 1, 10 μM on cell viability detected by CCK8. (B) Real-time PCR analyses for mRNA expression of Brd4. (C) Cell apoptosis was evaluated using flow cytometry. (D) ROS production was measured by flow cytometry.
Fig. S4
Fig. S4
(A) Western Blot analyses for protein expression of FoxO1 and FoxO3a in indicated groups (n = 3). (B) Real-time PCR analyses for expression of FOXO4. (C) ROS production was measured by flow cytometry. (D) Adenovirus carrying human FoxO4 compensates the reduction of ROS induced by JQ1. Flow cytometry was performed to measure ROS production.

Similar articles

Cited by

References

    1. Devarajan P. Update on mechanisms of ischemic acute kidney injury. J. Am. Soc. Nephrol. 2006;17(6):1503–1520. - PubMed
    1. Ikeda M., Prachasilchai W., Burne-Taney M.J., Rabb H., Yokota-Ikeda N. Ischemic acute tubular necrosis models and drug discovery: a focus on cellular inflammation. Drug Discov. Today. 2006;11(7–8):364–370. - PubMed
    1. Wang L., Chen H., Liu X.H., Chen Z.Y., Weng X.D., Qiu T., Liu L., Zhu H.C. Ozone oxidative preconditioning inhibits renal fibrosis induced by ischemia and reperfusion injury in rats. Exp. Ther. Med. 2014;8(6):1764–1768. - PMC - PubMed
    1. Li B., Haridas B., Jackson A.R., Cortado H., Mayne N., Kohnken R., Bolon B., Mchugh K.M., Schwaderer A.L., Spencer J.D., Ching C.B., Hains D.S., Justice S.S., Partida-Sanchez S., Becknell B. Inflammation drives renal scarring in experimental pyelonephritis. Am. J. Physiol. Renal. Physiol. 2017;312(1):F43–F53. - PMC - PubMed
    1. Havasi A., Borkan S.C. Apoptosis and acute kidney injury. Kidney Int. 2011;80(1):29–40. - PMC - PubMed

Publication types

MeSH terms

LinkOut - more resources