

Leveraging Human Microbiome Features to Diagnose and Stratify Children with Irritable Bowel Syndrome
- PMID: 31005411
- PMCID: PMC6504675
- DOI: 10.1016/j.jmoldx.2019.01.006
Leveraging Human Microbiome Features to Diagnose and Stratify Children with Irritable Bowel Syndrome
Abstract
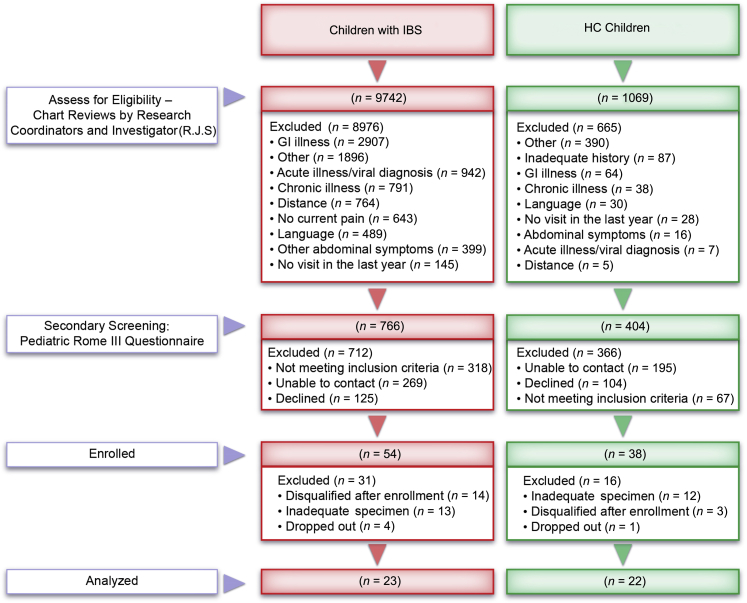
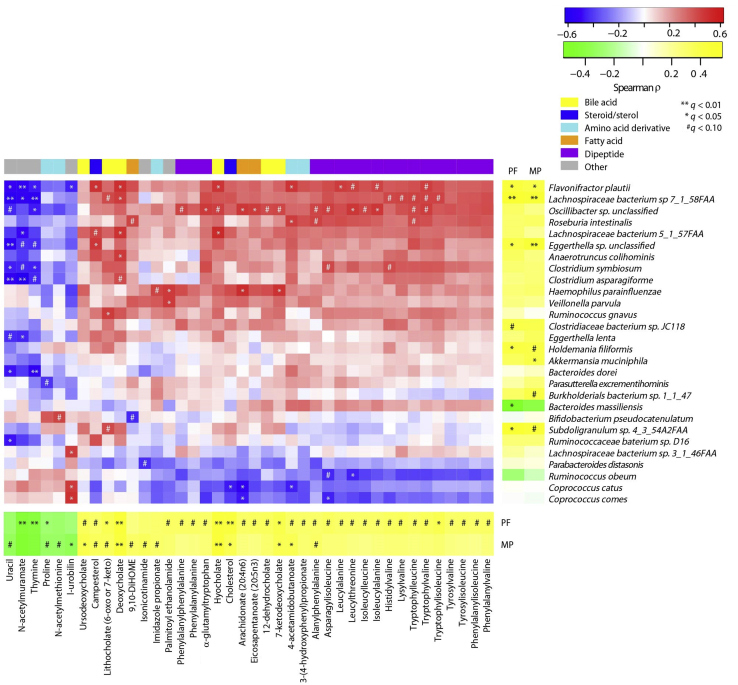
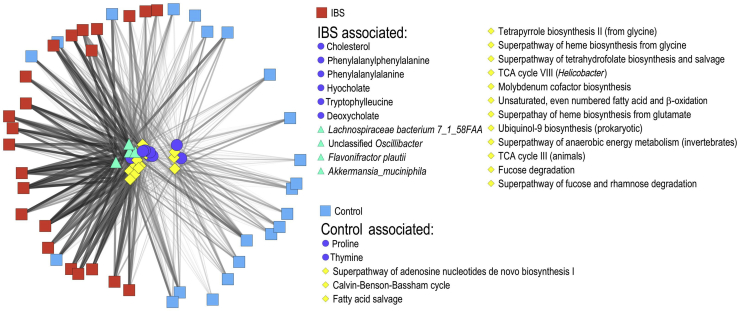
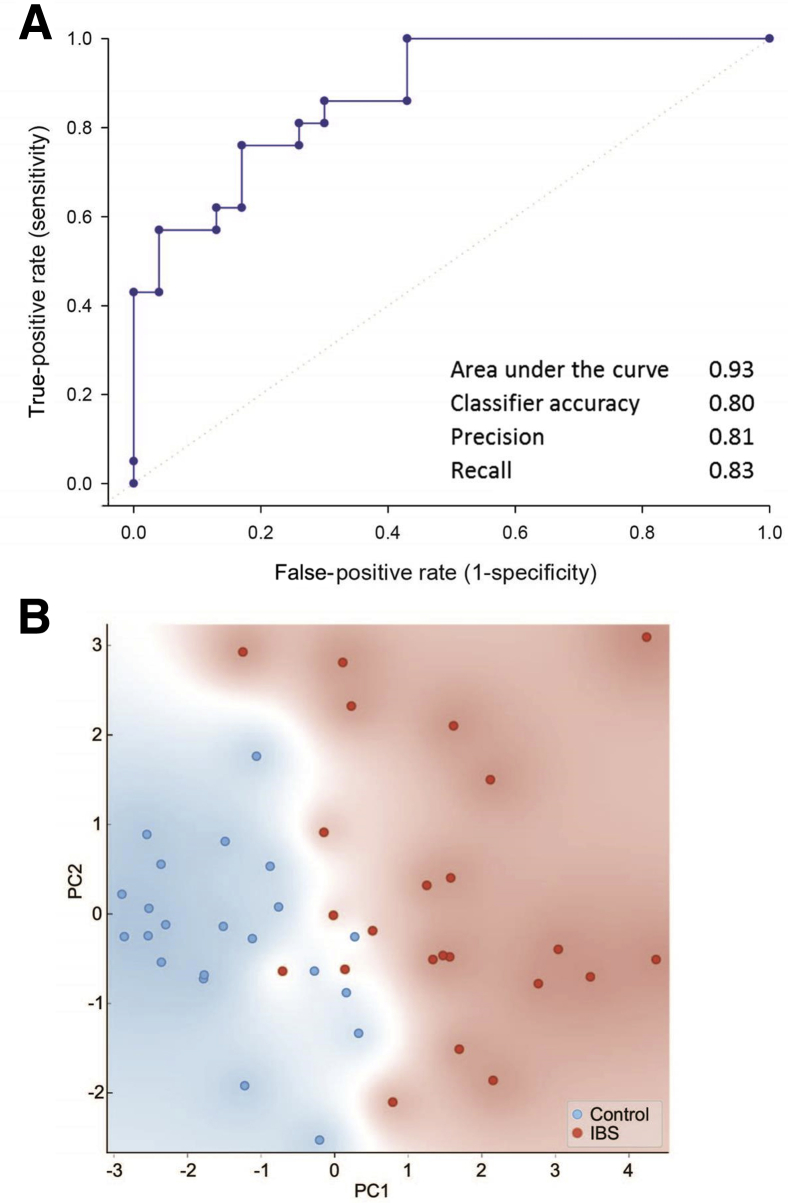
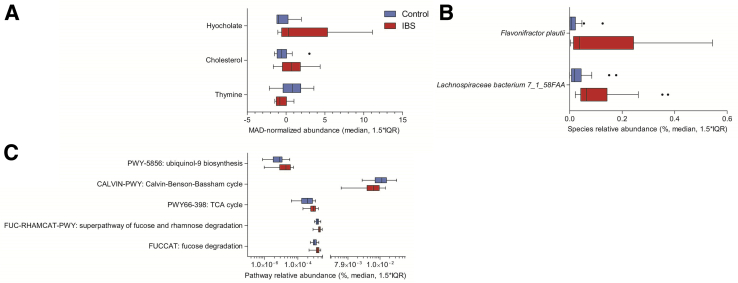
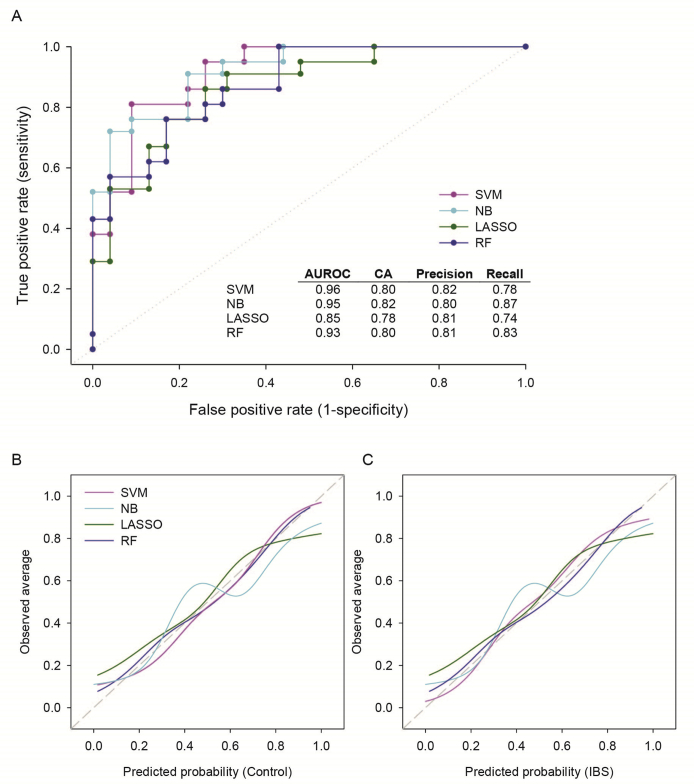
Accurate diagnosis and stratification of children with irritable bowel syndrome (IBS) remain challenging. Given the central role of recurrent abdominal pain in IBS, we evaluated the relationships of pediatric IBS and abdominal pain with intestinal microbes and fecal metabolites using a comprehensive clinical characterization and multiomics strategy. Using rigorous clinical phenotyping, we identified preadolescent children (aged 7 to 12 years) with Rome III IBS (n = 23) and healthy controls (n = 22) and characterized their fecal microbial communities using whole-genome shotgun metagenomics and global unbiased fecal metabolomic profiling. Correlation-based approaches and machine learning algorithms identified associations between microbes, metabolites, and abdominal pain. IBS cases differed from controls with respect to key bacterial taxa (eg, Flavonifractor plautii and Lachnospiraceae bacterium 7_1_58FAA), metagenomic functions (eg, carbohydrate metabolism and amino acid metabolism), and higher-order metabolites (eg, secondary bile acids, sterols, and steroid-like compounds). Significant associations between abdominal pain frequency and severity and intestinal microbial features were identified. A random forest classifier built on metagenomic and metabolic markers successfully distinguished IBS cases from controls (area under the curve, 0.93). Leveraging multiple lines of evidence, intestinal microbes, genes/pathways, and metabolites were associated with IBS, and these features were capable of distinguishing children with IBS from healthy children. These multi-omics features, and their links to childhood IBS coupled with nutritional interventions, may lead to new microbiome-guided diagnostic and therapeutic strategies.
Copyright © 2019 American Society for Investigative Pathology and the Association for Molecular Pathology. Published by Elsevier Inc. All rights reserved.
Figures
References
-
- Quigley E.M., Abdel-Hamid H., Barbara G., Bhatia S.J., Boeckxstaens G., De Giorgio R., Delvaux M., Drossman D.A., Foxx-Orenstein A.E., Guarner F., Gwee K.A., Harris L.A., Hungin A.P., Hunt R.H., Kellow J.E., Khalif I.L., Kruis W., Lindberg G., Olano C., Moraes-Filho J.P., Schiller L.R., Schmulson M., Simren M., Tzeuton C. A global perspective on irritable bowel syndrome: a consensus statement of the World Gastroenterology Organisation Summit Task Force on irritable bowel syndrome. J Clin Gastroenterol. 2012;46:356–366. - PubMed
-
- Cain K.C., Headstrom P., Jarrett M.E., Motzer S.A., Park H., Burr R.L., Surawicz C.M., Heitkemper M.M. Abdominal pain impacts quality of life in women with irritable bowel syndrome. Am J Gastroenterol. 2006;101:124–132. - PubMed
-
- Varni J.W., Shulman R.J., Self M.M., Nurko S., Saps M., Saeed S.A., Bendo C.B., Patel A.S., Dark C.V., Zacur G.M., Pohl J.F., Pediatric Quality of Life Inventory Gastrointestinal Symptoms Module Testing Study Consortium Symptom profiles in patients with irritable bowel syndrome or functional abdominal pain compared with healthy controls. J Pediatr Gastroenterol Nutr. 2015;61:323–329. - PubMed
Publication types
MeSH terms
Grants and funding
- U01 AI124290/AI/NIAID NIH HHS/United States
- K23 DK101688/DK/NIDDK NIH HHS/United States
- R01 NR013497/NR/NINR NIH HHS/United States
- UH3 DK083990/DK/NIDDK NIH HHS/United States
- R03 DK117219/DK/NIDDK NIH HHS/United States
- R01 NR005337/NR/NINR NIH HHS/United States
- P30 DK056338/DK/NIDDK NIH HHS/United States
- RC2 NR011959/NR/NINR NIH HHS/United States
- U01 CA170930/CA/NCI NIH HHS/United States
- U54 HG004973/HG/NHGRI NIH HHS/United States
- R01 AT004326/AT/NCCIH NIH HHS/United States
- R21 DK096323/DK/NIDDK NIH HHS/United States
LinkOut - more resources
Full Text Sources
Medical
