. 2019 May:43:594-606.
doi: 10.1016/j.ebiom.2019.04.027. Epub 2019 Apr 18.

Chronic heavy drinking drives distinct transcriptional and epigenetic changes in splenic macrophages

Affiliations

Chronic heavy drinking drives distinct transcriptional and epigenetic changes in splenic macrophages

Suhas Sureshchandra et al. EBioMedicine. 2019 May.

Abstract

Background: Chronic heavy alcohol drinking (CHD) leads to significant organ damage, increased susceptibility to infections, and delayed wound healing. These adverse outcomes are believed to be mediated by alterations in the function of myeloid cells; however, the mechanisms underlying these changes are poorly understood.

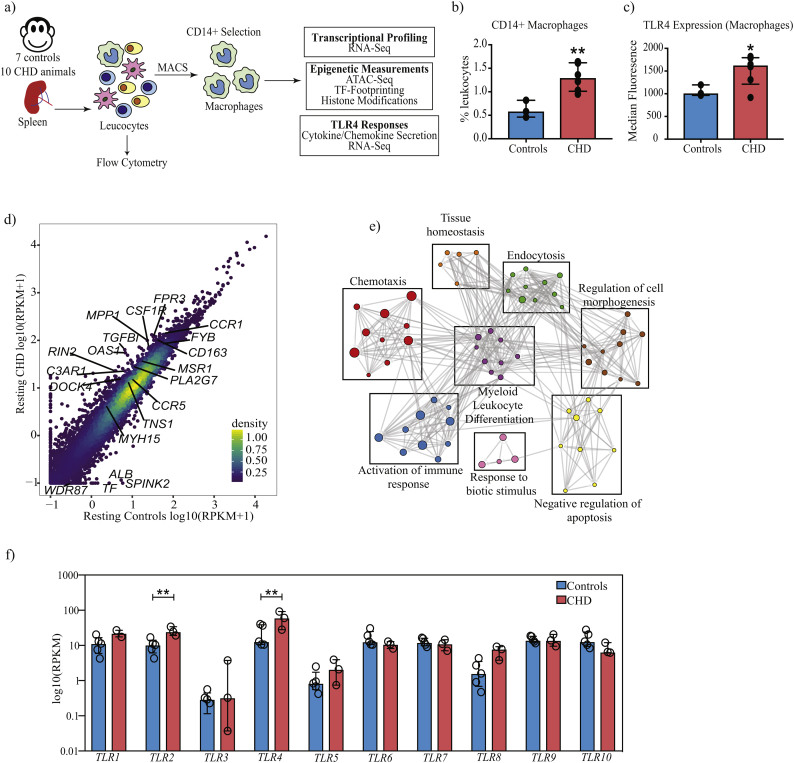
Methods: We determined the impact of CHD on the phenotype of splenic macrophages using flow cytometry. Changes in functional responses to LPS were measured using luminex and RNA-Seq. Finally, alterations in chromatin accessibility were uncovered using ATAC-Seq.

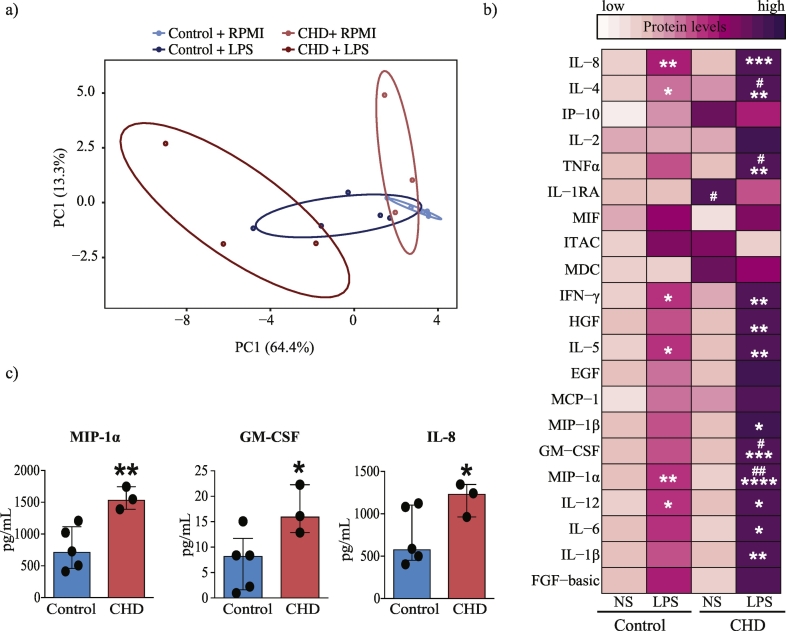
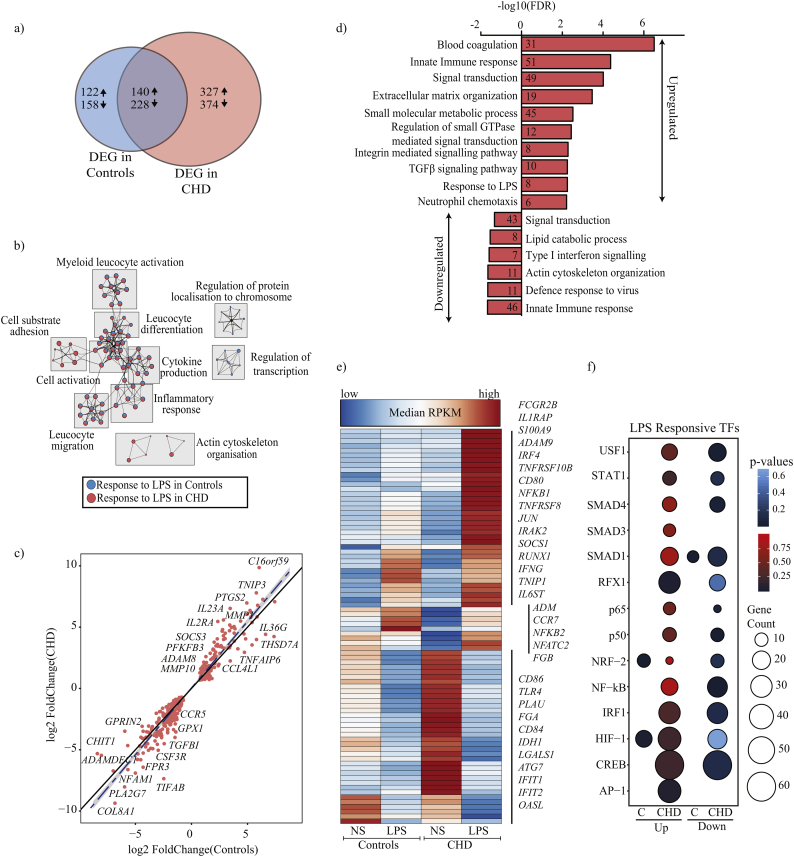
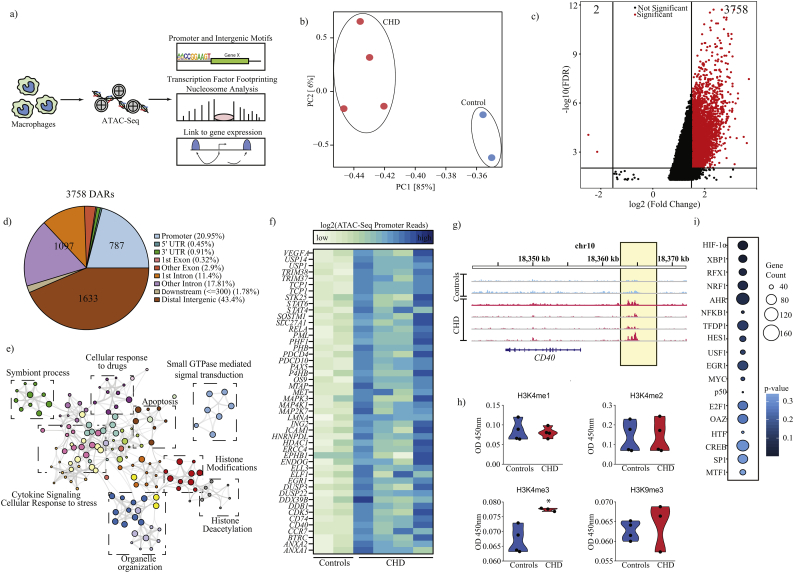
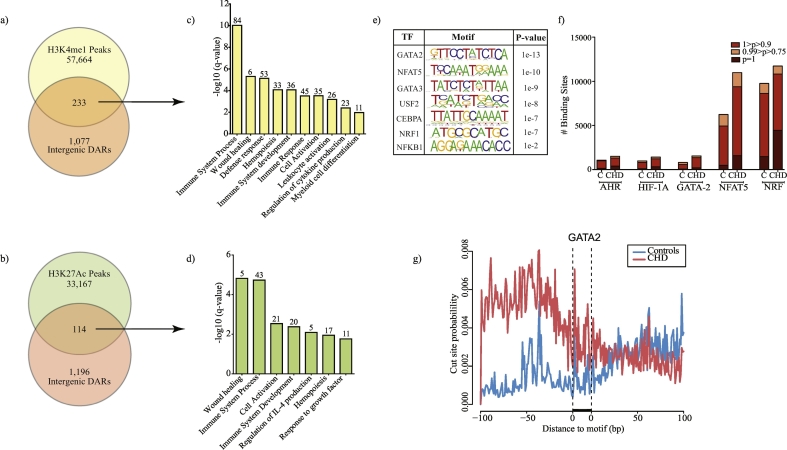
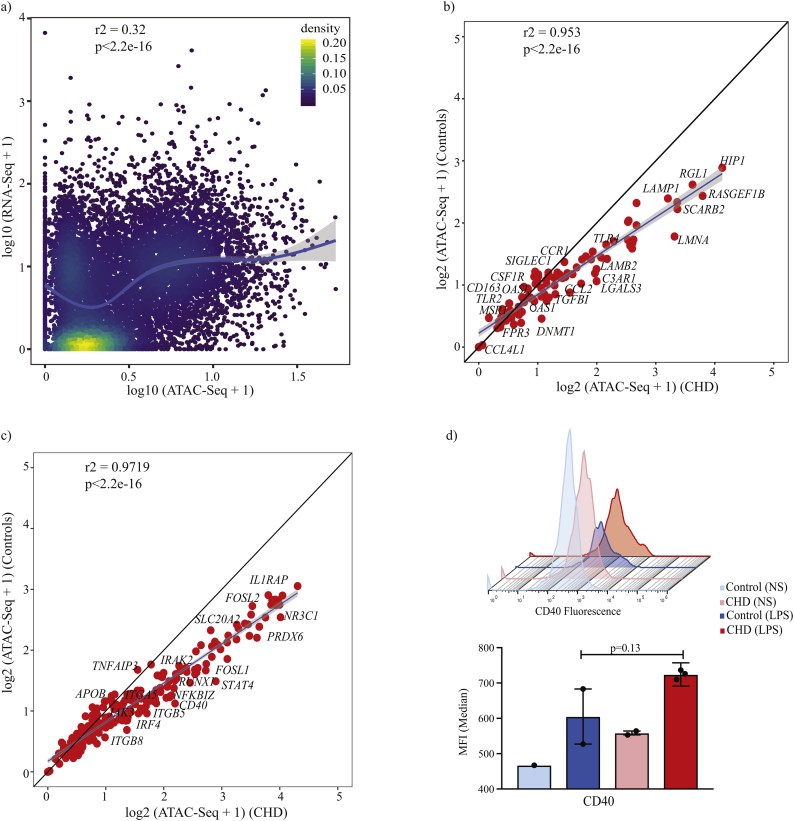
Findings: A history of CHD led to increased frequency of splenic macrophages that exhibited a heightened activation state at resting. Additionally, splenic macrophages from CHD animals generated a larger inflammatory response to LPS, both at protein and gene expression levels. Finally, CHD resulted in increased levels of H3K4me3, a histone mark of active promoters, as well as chromatin accessibility at promoters and intergenic regions that regulate inflammatory responses.

Interpretation: These findings suggest that a history of CHD alters the immune fitness of tissue-resident macrophages via epigenetic mechanisms. FUND: National Institute on Alcohol Abuse and Alcoholism (NIAAA), National Institutes of Health (NIH) - R24AA019431, U01 AA13641, U01 AA13510, R21AA021947, and R21AA025839.

Keywords: Chromatin accessibility; Chronic heavy drinking; Ethanol; LPS; Rhesus macaques; Splenic macrophages.


Figures

Fig. 1
Fig. 1
CHD is associated with transcriptional reprogramming of splenic macrophages. (a) Schematic of the experimental design. Splenocytes from 7 control and 10 CHD animals in total were used in this study. Except for flow cytometry, all other experiments were performed on purified CD14+ splenic macrophages. (b) Bar graph depicting the percentage of CD14+ macrophages in controls (n = 3) and CHD (n = 6) animals derived from the singlet gate of splenocytes. (** - p < 0·01, unpaired t-test with Welch's correction) (c) Bar graph showing differences in TLR4 surface expression within the CD14+ splenic macrophage populations of controls (n = 3) and CHD (n = 6) animals measured using flow cytometry. Median Fluorescence Intensity (MFI) is depicted on the Y-axis. (* - p < 0·05, unpaired t-test with Welch's correction) (d) Scatterplot comparing average normalised transcript counts (RPKM) from resting splenic macrophages in response to CHD. Select significantly differentially expressed genes (DEG) outside the confidence interval of the linear fit are highlighted. A total of 5 controls and 3 CHD animals were used in the RNA-Seq experiment. (e) Functional enrichment of DEG detected in resting splenic macrophages in response to CHD was carried out using Metascape. Each circle denotes a Gene Ontology (GO) term. The size of the circle indicates the number of DEG enriching to the GO term in question. Closely related (GO) terms are clustered into groups labelled with the most statistically significant GO term within that group. Grey lines indicate the relationship between different GO terms based on shared DEG. (f) Bar graphs showing normalised transcript counts (RPKM) of Toll-like receptors genes (TLR) (** - FDR <0·01, exact test in edgeR followed by FDR correction using Benjamini-Hochberg method).
Fig. 2
Fig. 2
CHD is associated with a hyper-inflammatory response to LPS in splenic macrophages. (a) Principal Component Analysis (PCA) of cytokines, chemokines, and growth factors produced by splenic macrophages from control (n = 5) and CHD (n = 3) animals in response to LPS and measured using Luminex. (b) Heatmap of individual secreted cytokines, chemokines, and growth factors produced spontaneously (NS) and in response to LPS stimulation (pg/mL). Significant increase in response to LPS stimulation in both groups is denoted by “*”; significant differences in mediators' levels between groups are denoted by “#” (p-values: */# - p < 0·05; **/## - p < 0·01; *** - p < 0·001; *** - p < 0·0001. Statistical analysis was carried out using ordinary one-way ANOVA (α = 0·05) with Sidak's multiple comparison tests. (c) Bar graphs of analytes with significantly higher levels of induction following LPS stimulation after correction for spontaneous production (NS) in the CHD group. (* - p < 0·05; ** - p < 0·01, unpaired t-test with Welch's correction)
Fig. 3
Fig. 3
CHD leads to heightened transcriptional responses to LPS in splenic macrophages. (a) Venn of DEG that were up- and down-regulated in splenic macrophages from control (n = 5) and CHD animals (n = 3) in response to LPS stimulation. Numbers and arrows within each circle represent the DEG numbers and direction of change relative to no stim samples respectively. (b) A network of functional enrichment of DEG detected in both groups following LPS stimulation identified by Metascape. Each box delineates a group of highly related GO terms; each GO term is shown as a pie chart that depict the relative transcriptional contributions from control and CHD groups (blue-controls; red-CHD). The size of the pie chart is indicative of the number of DEG enriching to that GO term, and the lines indicate relationship between GO terms based on shared DEG. (c) Scatter plot comparing fold changes of a subset of DEG detected in both groups in response to LPS. Innate immune genes outside the confidence interval (grey highlight) of the linear fit (dashed blue line) are annotated. (d) Functional enrichment of up and down-regulated DEG detected exclusively in CHD samples following LPS stimulation. (e) Clustered heatmap of up- or down-regulated DEG detected only in CHD samples post LPS exposure that enriched to GO term “innate immune response”. Colours on the heatmap represent scaled median RPKMs ranging from low (blue) to high (red) expression. (f) Bubble plots of up- (red) and down-regulated (blue) genes regulated by LPS responsive transcription factors (TF) as predicted by CisRed. Size and colour of the bubble represent the number of genes mapped and statistical significance (hypergeometric test) respectively. (For interpretation of the references to colour in this figure legend, the reader is referred to the web version of this article.)
Fig. 4
Fig. 4
Chronic heavy ethanol consumption alters chromatin accessibility. (a) Experimental design for ATAC-Seq and downstream in silico analyses. (b) PCA of chromatin accessibility profiles (peaks) of splenic macrophages from control (n = 2) and CHD animals (n = 4). (c) Volcano plot showing cutoffs used to identify differentially accessible regions (DAR) in macrophages from CHD compared to control animals. X and Y-axes represent fold change and FDR (−log10) respectively. DAR were defined as those with |FC| ≥ 1·5 and FDR ≤ 0·01 (Wald test). (d) Genomic contexts of DAR showing preferential mapping to intergenic and promoter regions. (e) A network of biological processes to which genes regulated by promoters that are significantly more accessible with CHD enrich generated using Metascape. Each coloured circle represents a GO term and the size of the circle indicated the number of DEG enriching to it. Closely related GO terms are clustered within a group labelled with the name of the most significant GO term in that cluster. Grey lines indicate associations between the different GO terms based on shared DEG. (f) Heatmap of ATAC-Seq read pileups overlapping promoters of genes that enriched to GO terms “cellular response to stress”, “cytokine signalling”,” histone modifications”, and “histone deacetylation”. (g) Representative pileups demonstrating increased accessibility (highlighted in yellow) upstream of CD40 promoter with CHD. (h) Box plots representing differences in histone activation and repressive marks in controls (n = 4) and CHD animals (n = 3) (* - p-value <0·05, unpaired t-test with Welch's correction). (i) Bubble plots summarising transcriptional factor binding site (TFBS) enrichment of genes regulated by the promoters that are more accessible in splenic macrophages from CHD animals predicted by cisRed. Size and colour of the bubble represent the number of genes mapped and statistical significance (hypergeometric test) respectively. (For interpretation of the references to colour in this figure legend, the reader is referred to the web version of this article.)
Fig. 5
Fig. 5
CHD associated changes in the regulatory landscape of macrophage chromatin. (a, b) Venn of distal intergenic differences observed with CHD compared with (a) poised and (b) active enhancer regions in monocyte-derived macrophages [41]. Comparisons were made following liftOver of macaque genomic loci to human hg19 reference. (c, d) Functional enrichment of genes associated with intergenic (c) poised and (d) active enhancer regions more significantly accessible in CHD animals using GREAT. (e) Summary of transcription factors (TF) with over-represented motifs overlapping differentially accessible intergenic regions identified using HOMER (hypergeometric test). (f) Bar graph showing the number of binding sites for a subset of TFs predicted to bind to promoter and intergenic regions using InnateDB (Fig. 4I) and HOMER (Fig. 5e) respectively determined using TF footprinting tool CENTIPEDE. (g) CENTIPEDE derived binding probability graph around GATA2 motif in macrophages from controls (blue) and CHD (red) animals. (For interpretation of the references to colour in this figure legend, the reader is referred to the web version of this article.)
Fig. 6
Fig. 6
Integration of RNA-Seq and ATAC-Seq links CHD associated epigenetic changes with post LPS responses. (a) Scatter plots comparing expression (median RPKM) and normalised promoter ATAC-Seq pileups of all the genes in the CHD group. Association was tested using Spearman correlation test and curve fit using polynomial loess regression. Each dot is a gene and colours of the dots represent the relative overlap of the two distributions. (b) Scatter plot comparing ATAC-Seq readouts at promoters of genes differentially expressed with CHD at resting from control and CHD animals. Linear regression and association were tested using Pearson's correlation test. (c) Scatter plot comparing ATAC-Seq readouts from control and CHD animals at promoters of genes differentially expressed exclusively with CHD in response to LPS. Linear regression and association were tested using Pearson's correlation test. (d) Histogram and bar graphs comparing surface CD40 induction with 16 h LPS exposure in macrophages from controls (post stim, n = 2) and CHD (post stim, n = 3) animals (p-values from unpaired t-test with Welch's correction).

Similar articles

Cited by

References

    1. Schmidt W., De Lint J. Causes of death of alcoholics. Q J Stud Alcohol. 1972;33(1):171–185. - PubMed
    1. Saitz R., Ghali W.A., Moskowitz M.A. The impact of alcohol-related diagnoses on pneumonia outcomes. Arch Intern Med. 1997;157(13):1446–1452. - PubMed
    1. Sabot G., Vendrame G. Incidence of pulmonary tuberculosis in alcoholics. Study based on investigations made at the Ospedale Psichiatrico Provinciale di Udine in the decade 1958-1967. Minerva Med. 1969;60(101):5190–5194. - PubMed
    1. Hudolin V. Tuberculosis and alcoholism. Ann N Y Acad Sci. 1975;252:353–364. - PubMed
    1. Baum M.K., Rafie C., Lai S., Sales S., Page J.B., Campa A. Alcohol use accelerates HIV disease progression. AIDS Res Hum Retroviruses. 2010;26(5):511–518. - PMC - PubMed

MeSH terms