. 2019 Apr 24;8(4):292-301.e3.
doi: 10.1016/j.cels.2019.03.006. Epub 2019 Apr 17.

End-to-End Differentiable Learning of Protein Structure

Affiliations

End-to-End Differentiable Learning of Protein Structure

Mohammed AlQuraishi. Cell Syst. .

Abstract

Predicting protein structure from sequence is a central challenge of biochemistry. Co-evolution methods show promise, but an explicit sequence-to-structure map remains elusive. Advances in deep learning that replace complex, human-designed pipelines with differentiable models optimized end to end suggest the potential benefits of similarly reformulating structure prediction. Here, we introduce an end-to-end differentiable model for protein structure learning. The model couples local and global protein structure via geometric units that optimize global geometry without violating local covalent chemistry. We test our model using two challenging tasks: predicting novel folds without co-evolutionary data and predicting known folds without structural templates. In the first task, the model achieves state-of-the-art accuracy, and in the second, it comes within 1-2 Å; competing methods using co-evolution and experimental templates have been refined over many years, and it is likely that the differentiable approach has substantial room for further improvement, with applications ranging from drug discovery to protein design.

Keywords: biophysics; co-evolution; deep learning; geometric deep learning; homology modeling; machine learning; protein design; protein folding; protein structure prediction; structural biology.


Conflict of interest statement

Declaration of Interests:

The author declares no competing interests.

Figures
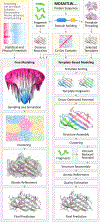
Figure 1:
Figure 1:. Conventional pipelines for protein structure prediction.
Prediction process begins with query sequence (top, green box) whose constituent domains and co-evolutionary relationships are identified through multiple sequence alignments. In free modeling (left), fragment libraries are searched to derive distance restraints which, along with restraints derived from co-evolutionary data, guide simulations that iteratively minimize energy through sampling. Coarse conformations are then refined to yield the final structure. In template-based modeling (right pipeline), the PDB is searched for templates. If found, fragments from one or more templates are combined to assemble a structure, which is then optimized and refined to yield the final structure. Orange boxes indicate sources of input information beyond query sequence, including prior physical knowledge. Diagram is modeled on the I-Tasser and Quark pipelines (Zhang et al.).
Figure 2:
Figure 2:. Recurrent geometric networks.
Protein sequences are fed one residue at a time to the computational units of an RGN (bottom-left), which compute an internal state that is integrated with the states of adjacent units. Based on these computations, torsional angles are predicted and fed to geometric units, which sequentially translate them into Cartesian coordinates to generate the predicted structure. dRMSD is used to measure deviation from experimental structures, serving as the signal for optimizing RGN parameters. Top-Left Inset: Geometric units take new torsional angles and a partial backbone chain, and extend it by one residue. Bottom-Right Inset: Computational units, based on Long Short-Term Memory (LSTMs) (Hochreiter and Schmidhuber, 1997), use gating units (blue) to control information flow in and out of the internal state (gray), and angularization units (purple) to convert raw outputs into angles. Rightmost Inset: Angularization units select from a learned set of torsion angles (“alphabet”) a mixture of torsions, which are then averaged in a weighted manner to generate the final set of torsions. Mixing weights are determined by computational units.
Figure 3:
Figure 3:. Results overview.
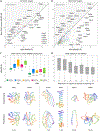
Scatterplots of individual FM (A) and TBM (B) predictions made by RGN and top CASP server. Two TBM outliers (T0629 and T0719) were dropped for visualization purposes. (C) Distributions of mean dRMSD (lower is better, white is median) achieved by servers predicting all structures with >95% coverage at CASP 8–12 are shown for FM (novel folds) and TBM (known folds) categories. Thick black (white on dark background) bars mark RGN dRMSD. RGN percentile rankings are shown for the TBM category (below whiskers). CASP 7 is omitted due to lack of server metadata. (D) Distribution of RGN dRMSDs on ProteinNet validation sets grouped by maximum % sequence identity to training set over all CASPs (medians are wide white lines, means are short white lines.) (E) Traces of backbone atoms of well (left), fairly (middle), and poorly (right) predicted RGN structures are shown (bottom) along with their experimental counterparts (top). CASP identifier is displayed above each structure and dRMSD below. A color spectrum spans each protein chain to aid visualization. See also Figure S1.
Figure 4:
Figure 4:. Correlation between prediction accuracy and template quality.
Scatterplots of fragment RMSDs, ranging in size from 5 to 50 residues, comparing the best CASP templates to the best CASP server predictions (top) and RGN predictions (bottom). R2 values are computed over all data points (non-parenthesized), and over data points in which predictions achieved <3Å accuracy (parenthesized). TBM domains were used (excluding TBM-hard which do not have good templates), and only templates and predictions covering >85% of full domain sequences were considered. Templates and predictions were selected based on global dRMSD with respect to experimental structure. CASP 7 and 8 are omitted due to lack of full template information.
Figure 5:
Figure 5:. The latent space of RGNs.
2D projection of the separate (A) and combined (B) internal state of all RGN computational layers, with dots corresponding to individual protein sequences in the ProteinNet12 training set. (B) Proteins are colored by fractional secondary structure content, as determined by annotations of original protein structures. (C) Contour plots of the probability density (50–90% quantiles) of proteins belonging to categories in the topmost level of the CATH hierarchy (first from left) and proteins belonging to categories in the second-level CATH classes of “Mainly Alpha” (second), “Mainly Beta” (third), and “Alpha Beta” (fourth). Distinct colors correspond to distinct CATH categorizations; see Figure S2–S5 for complete legends. The topmost CATH class “Few Secondary Structures” is omitted because it has no subcategories.

Similar articles

Cited by

References

    1. Abadi M, Barham P, Chen J, Chen Z, Davis A, Dean J, Devin M, Ghemawat S, Irving G, Isard M, et al. (2016). TensorFlow: A system for large-scale machine learning In 12th USENIX Symposium on Operating Systems Design and Implementation (OSDI 16), pp. 265–283.
    1. Adhikari B, Bhattacharya D, Cao R, and Cheng J (2015). CONFOLD: Residue-residue contact-guided ab initio protein folding. Proteins 83, 1436–1449. - PMC - PubMed
    1. Alain G, and Bengio Y (2016). Understanding intermediate layers using linear classifier probes. ArXiv:1610.01644 [Cs, Stat].
    1. AlQuraishi M (2019a). Parallelized Natural Extension Reference Frame: Parallelized Conversion from Internal to Cartesian Coordinates. Journal of Computational Chemistry 40, 885–892. - PubMed
    1. AlQuraishi M (2019b). ProteinNet: a standardized data set for machine learning of protein structure. ArXiv:1902.00249 [Cs, q-Bio, Stat]. - PMC - PubMed

Publication types