Ankle power biofeedback attenuates the distal-to-proximal redistribution in older adults
- PMID: 31005854
- PMCID: PMC7897464
- DOI: 10.1016/j.gaitpost.2019.04.011
Ankle power biofeedback attenuates the distal-to-proximal redistribution in older adults
Abstract
Background: Compared to young adults, older adults walk slower, with shorter strides, and with a characteristic decrease in ankle power output. Seemingly in response, older adults rely more than young on hip power output, a phenomenon known as a distal-to-proximal redistribution. Nevertheless, older adults can increase ankle power to walk faster or uphill, revealing a translationally important gap in our understanding.
Research question: Our purpose was to implement a novel ankle power biofeedback paradigm to encourage favorable biomechanical adaptations (i.e. reverse the distal-redistribution) during habitual speed walking in older adults.
Methods: 10 healthy older adults walked at their preferred speeds while real-time visual biofeedback provided target increases and decreases of 10 and 20% different from preferred ankle power. We evaluated the effect of changes in ankle power on joint kinetics, kinematics, and propulsive ground reaction forces. Pre and post overground walking speed assessments evaluated the effect of increased ankle power recall on walking speed.
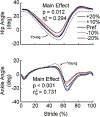
Results: Biofeedback systematically elicited changes in ankle power; increasing and decreasing ankle power by 14% and 17% when targeting ±20% different from preferred, respectively. We observed a significant negative correlation between ankle power and hip extensor work. Older adults relied more heavily on changes in ankle angular velocity than ankle moment to modulate ankle power. Lastly, older adults walked almost 11% faster when recalling increased ankle power overground.
Significance: Older adults are capable of increasing ankle power through targeted ankle power biofeedback - effects that are accompanied by diminished hip power output and attenuation of the distal-to-proximal redistribution. The associated increase in preferred walking speed during recall suggests a functional benefit to increased ankle power output via transfer to overground walking. Further, our mechanistic insights allude to translational success using ankle angular velocity as a surrogate to modulate ankle power through biofeedback.
Keywords: Elderly; Gait; Hip; Plantarflexor; Push-off.
Copyright © 2019 Elsevier B.V. All rights reserved.
Conflict of interest statement
CONFLICT OF INTEREST
The authors report no conflict of interest.
Figures


Similar articles
-
Biomechanical effects of augmented ankle power output during human walking.J Exp Biol. 2018 Nov 16;221(Pt 22):jeb182113. doi: 10.1242/jeb.182113. J Exp Biol. 2018. PMID: 30266784 Free PMC article.
-
More push from your push-off: Joint-level modifications to modulate propulsive forces in old age.PLoS One. 2018 Aug 8;13(8):e0201407. doi: 10.1371/journal.pone.0201407. eCollection 2018. PLoS One. 2018. PMID: 30089143 Free PMC article. Clinical Trial.
-
Effects of age, speed, and step length on lower extremity net joint moments and powers during walking.Hum Mov Sci. 2020 Jun;71:102611. doi: 10.1016/j.humov.2020.102611. Epub 2020 Mar 26. Hum Mov Sci. 2020. PMID: 32452428
-
Contributions to the understanding of gait control.Dan Med J. 2014 Apr;61(4):B4823. Dan Med J. 2014. PMID: 24814597 Review.
-
Effects of walking speed on gait biomechanics in healthy participants: a systematic review and meta-analysis.Syst Rev. 2019 Jun 27;8(1):153. doi: 10.1186/s13643-019-1063-z. Syst Rev. 2019. PMID: 31248456 Free PMC article.
Cited by
-
Muscle metabolic energy costs while modifying propulsive force generation during walking.Comput Methods Biomech Biomed Engin. 2021 Nov;24(14):1552-1565. doi: 10.1080/10255842.2021.1900134. Epub 2021 Mar 22. Comput Methods Biomech Biomed Engin. 2021. PMID: 33749464 Free PMC article.
-
These legs were made for propulsion: advancing the diagnosis and treatment of post-stroke propulsion deficits.J Neuroeng Rehabil. 2020 Oct 21;17(1):139. doi: 10.1186/s12984-020-00747-6. J Neuroeng Rehabil. 2020. PMID: 33087137 Free PMC article. Review.
-
Ankle-targeted exosuit resistance increases paretic propulsion in people post-stroke.J Neuroeng Rehabil. 2023 Jun 30;20(1):85. doi: 10.1186/s12984-023-01204-w. J Neuroeng Rehabil. 2023. PMID: 37391851 Free PMC article.
-
The Effect of Shoe Insole Stiffness Modifications on Walking Performance in Older Adults: A Feasibility Study.J Appl Biomech. 2025 Jan 3;41(2):124-131. doi: 10.1123/jab.2024-0150. Print 2025 Apr 1. J Appl Biomech. 2025. PMID: 39753120 Free PMC article.
-
Indirect measurement of anterior-posterior ground reaction forces using a minimal set of wearable inertial sensors: from healthy to hemiparetic walking.J Neuroeng Rehabil. 2020 Jun 29;17(1):82. doi: 10.1186/s12984-020-00700-7. J Neuroeng Rehabil. 2020. PMID: 32600348 Free PMC article.
References
-
- Beijersbergen CM, Granacher U, Vandervoort AA, DeVita P, Hortobagyi T. The biomechanical mechanism of how strength and power training improves walking speed in old adults remains unknown. Ageing research reviews. 2013;12:618–27. - PubMed
-
- Beijersbergen CM, Granacher U, Gabler M, DeVita P, Hortobagyi T. Hip mechanics underlie lower extremity power training-induced increase in old adults’ fast gait velocity: The Potsdam Gait Study (POGS). Gait Posture. 2017;52:338–44. - PubMed
Publication types
MeSH terms
Grants and funding
LinkOut - more resources
Full Text Sources
Miscellaneous

