Meta-Analysis
. 2019 Jun 1;109(6):1724-1737.
doi: 10.1093/ajcn/nqz043.

New insight into human sweet taste: a genome-wide association study of the perception and intake of sweet substances

Affiliations
Meta-Analysis

New insight into human sweet taste: a genome-wide association study of the perception and intake of sweet substances

Liang-Dar Hwang et al. Am J Clin Nutr. .

Abstract

Background: Individual differences in human perception of sweetness are partly due to genetics; however, which genes are associated with the perception and the consumption of sweet substances remains unclear.

Objective: The aim of this study was to verify previous reported associations within genes involved in the peripheral receptor systems (i.e., TAS1R2, TAS1R3, and GNAT3) and reveal novel loci.

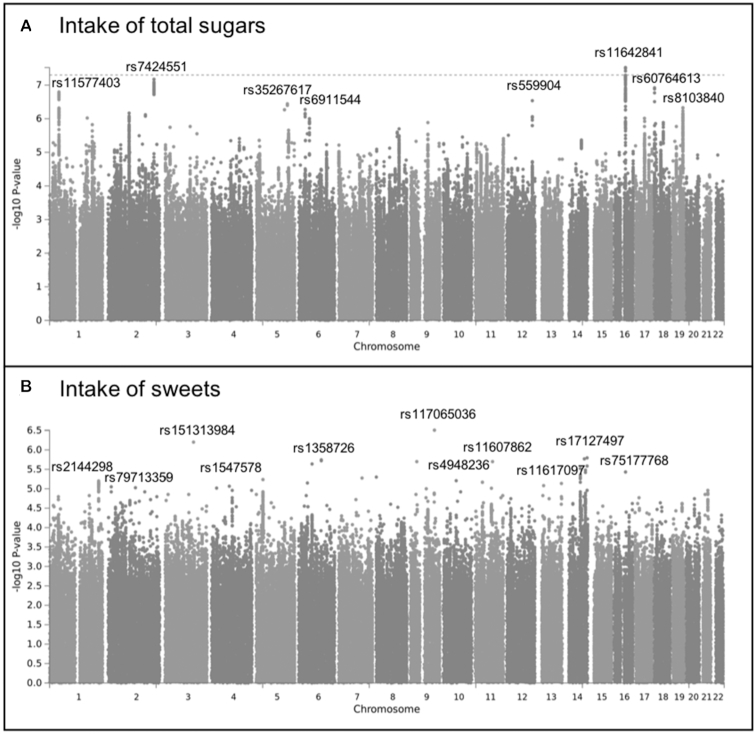
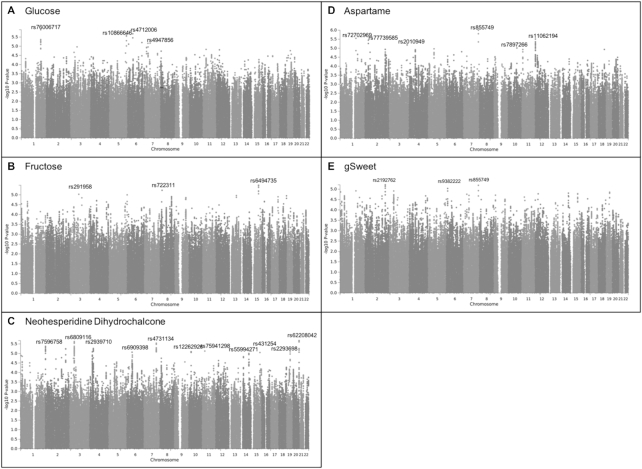
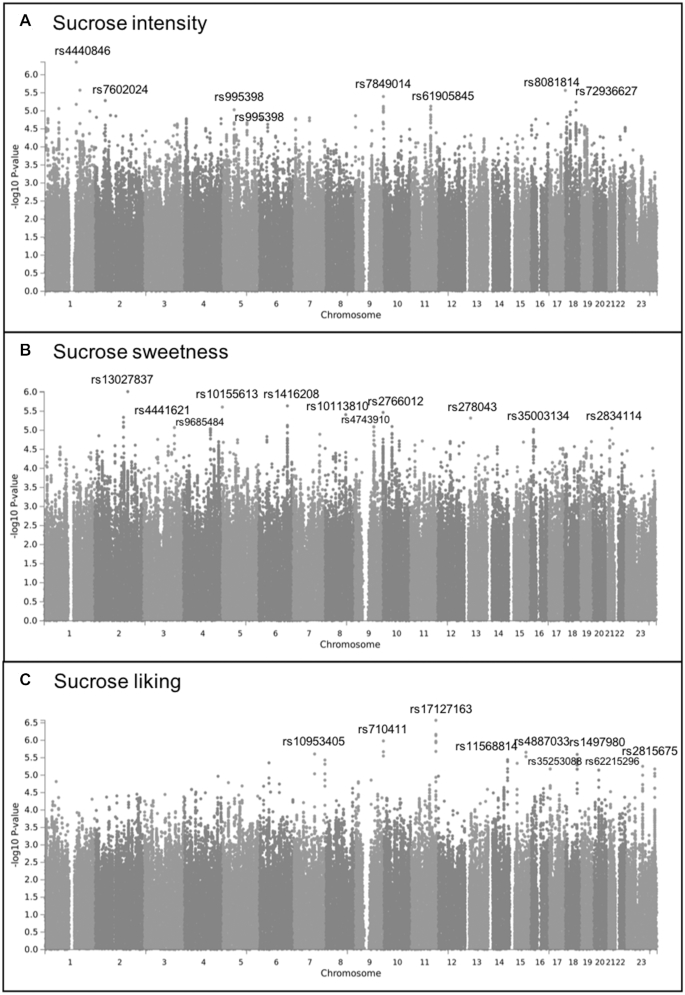
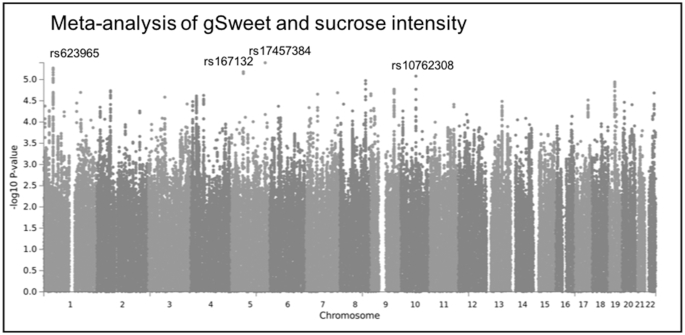
Methods: We performed genome-wide association scans (GWASs) of the perceived intensity of 2 sugars (glucose and fructose) and 2 high-potency sweeteners (neohesperidin dihydrochalcone and aspartame) in an Australian adolescent twin sample (n = 1757), and the perceived intensity and sweetness and the liking of sucrose in a US adult twin sample (n = 686). We further performed GWASs of the intake of total sugars (i.e., total grams of all dietary mono- and disaccharides per day) and sweets (i.e., handfuls of candies per day) in the UK Biobank sample (n = ≤174,424 white-British individuals). All participants from the 3 independent samples were of European ancestry.

Results: We found a strong association between the intake of total sugars and the single nucleotide polymorphism rs11642841 within the FTO gene on chromosome 16 (P = 3.8 × 10⁻⁸) and many suggestive associations (P < 1.0 × 10⁻⁵) for each of the sweet perception and intake phenotypes. We showed genetic evidence for the involvement of the brain in both sweet taste perception and sugar intake. There was limited support for the associations with TAS1R2, TAS1R3, and GNAT3 in all 3 European samples.

Conclusions: Our findings indicate that genes additional to those involved in the peripheral receptor system are also associated with the sweet taste perception and intake of sweet-tasting foods. The functional potency of the genetic variants within TAS1R2, TAS1R3, and GNAT3 may be different between ethnic groups and this warrants further investigations.

Keywords: FTO; BMI; genome-wide association scan; perception; preference; sugar intake; sweet taste; taste receptor.


Figures

FIGURE 1
FIGURE 1
Manhattan plots displaying the association -log10P value for each SNP in the genome and the intake of total sugars (grams per day; n = 174,424) (A) and the intake of sweets (handfuls of candies per day; n = 21,447) (B) in the UK Biobank white-British participants. Only the top SNP with P < 1.0 × 10−5 for each chromosome is labeled. SNP, single nucleotide polymorphism.
FIGURE 2
FIGURE 2
Manhattan plots displaying the association -log10P value for each SNP in the genome and the perceived intensity of glucose (A), fructose (B), NHDC (C), aspartame (D), and gSweet (E) in 1757 Australian adolescent twins and their siblings. Only the top SNP with P < 1.0 × 10−5 for each chromosome is labeled. gSweet, general sweet factor (a weighted mean of ratings of glucose, fructose, NHDC, and aspartame); NHDC, neohesperidin dihydrochalcone; SNP, single nucleotide polymorphism.
FIGURE 3
FIGURE 3
Manhattan plots displaying the association -log10P value for each SNP in the genome and the perception of sucrose reported via ratings of intensity (A), sweetness (B), and liking (C) in 686 US adult twins and unpaired individuals. Only the top SNP with P < 1.0 × 10−5 for each chromosome is labeled. SNP, single nucleotide polymorphism.
FIGURE 4
FIGURE 4
Manhattan plot for the meta-analysis of the perceived intensity of gSweet (Figure 2E) and sucrose (Figure 3A). The top single nucleotide polymorphism with P < 1.0 × 10−5 for each chromosome is labeled. gSweet, general sweet factor (a weighted mean of ratings of glucose, fructose, neohesperidin dihydrochalcone, and aspartame).
FIGURE 5
FIGURE 5
Heatmap showing the effect of SNP on the perceived intensity of glucose, fructose, NHDC, aspartame, and gSweet in the Australian sample, the perceived intensity, sweetness, and liking for sucrose in the US sample, and the intake of sugars (grams per day) and sweets (handfuls of candies per day) in the UK Biobank. Effect sizes are presented as β/SE (see Supplemental Table 5 for details) and range from −2.63 to 5.2, with negative and positive values coded in blue and red colors, respectively. SNPs identified in the Australian sample affect all 5 Australian phenotypes in the same direction and those identified in the US sample affect all 3 US phenotypes in the same direction. Although these effects appear to be sample-specific, meta-analysis identified 4 additional SNPs that have similar effects in both samples, of which rs17457384 is associated with sweets intake in the UK Biobank, with the allele for higher intensity ratings leading to a lower intake. gSweet, general sweet factor (a weighted mean of ratings of glucose, fructose, NHDC, and aspartame); NHDC, neohesperidin dihydrochalcone; SNP, single nucleotide polymorphism. * , P < 0.05; **, P < 1.0 × 10 −5; −, SNP not available.

Similar articles

Cited by

References

    1. Keskitalo K, Silventoinen K, Tuorila H, Perola M, Pietilainen KH, Rissanen A, Kaprio J. Genetic and environmental contributions to food use patterns of young adult twins. Physiol Behav. 2008;93(1–2):235–42. - PMC - PubMed
    1. Knaapila A, Hwang LD, Lysenko A, Duke FF, Fesi B, Khoshnevisan A, James RS, Wysocki CJ, Rhyu M, Tordoff MG et al. .. Genetic analysis of chemosensory traits in human twins. Chem Senses. 2012;37(9):869–81. - PMC - PubMed
    1. Keskitalo K, Knaapila A, Kallela M, Palotie A, Wessman M, Sammalisto S, Peltonen L, Tuorila H, Perola M. Sweet taste preferences are partly genetically determined: identification of a trait locus on chromosome 16. Am J Clin Nutr. 2007;86(1):55–63. - PubMed
    1. Smith AD, Fildes A, Forwood S, Cooke L, Llewellyn C. The individual environment, not the family is the most important influence on preferences for common non-alcoholic beverages in adolescence. Sci Rep. 2017;7(1):16822. - PMC - PubMed
    1. Hwang LD, Zhu G, Breslin PA, Reed DR, Martin NG, Wright MJ. A common genetic influence on human intensity ratings of sugars and high-potency sweeteners. Twin Res Hum Genet. 2015;18(4):361–7. - PubMed

Publication types