Review
. 2019 Jun 10;374(1774):20180376.
doi: 10.1098/rstb.2018.0376.

Statistical physics of liquid brains

Affiliations
Review

Statistical physics of liquid brains

Jordi Piñero et al. Philos Trans R Soc Lond B Biol Sci. .

Abstract

Liquid neural networks (or 'liquid brains') are a widespread class of cognitive living networks characterized by a common feature: the agents (ants or immune cells, for example) move in space. Thus, no fixed, long-term agent-agent connections are maintained, in contrast with standard neural systems. How is this class of systems capable of displaying cognitive abilities, from learning to decision-making? In this paper, the collective dynamics, memory and learning properties of liquid brains is explored under the perspective of statistical physics. Using a comparative approach, we review the generic properties of three large classes of systems, namely: standard neural networks (solid brains), ant colonies and the immune system. It is shown that, despite their intrinsic physical differences, these systems share key properties with standard neural systems in terms of formal descriptions, but strongly depart in other ways. On one hand, the attractors found in liquid brains are not always based on connection weights but instead on population abundances. However, some liquid systems use fluctuations in ways similar to those found in cortical networks, suggesting a relevant role for criticality as a way of rapidly reacting to external signals. This article is part of the theme issue 'Liquid brains, solid brains: How distributed cognitive architectures process information'.

Keywords: brains; collective intelligence; criticality; evolution; phase transitions.


Conflict of interest statement

We have no competing interests.

Figures

Figure 1.
Figure 1.
Network interactions in liquid versus solid brains. The three case studies analysed in this paper are shown, with examples of the agents involved in each case. (a) Standard neural networks involve spatially localized cells connected through synaptic weights. In contrast with this architecture, liquid brains, including (b) ant colonies and (c) the IS include mobile agents (or cell subsets) interacting in space and time with no fixed pairwise weights. A schematic of each case study is outlined in the row below. Standard neural networks are defined in terms of connected excitable elements that can be roughly classified in active (firing) and inactive (quiescent) neurons, here indicated as filled and open circles, respectively (d). The wiring matrix remains basically the same in terms of topology (who is connected with whom) but will be modified in strength due to experience. By contrast, ant colonies must be represented by disconnected graphs (e) where interactions are possible within a given spatial range, here indicated by means of the grey circle. The IS allows several representations of the interactions, but in many cases it is the molecular interaction between epitopes (strings of symbols in (f)) that truly represents the underlying liquid brain dynamics.
Figure 2.
Figure 2.
Distributed computation in neural networks. Using a very simple set of rules, an NN model can store and retrieve memories in a robust manner. In the Hopfield’s model, a massively connected set of neurons (a) with symmetric connections obeying Hebb’s rule (b) will display such properties. In (b), a pair of formal neurons is shown receiving inputs ξi, ξj ∈ {−1, 1} from a given memory state or pattern ξμ. If they are identical, i.e. ξi = ξj, their connection is increased (in both directions). Otherwise, Jij is decreased. (c) Network dynamics makes the system’s state flow to energy minima, thus recovering the desired memory state. The model exhibits remarkable reliability against connection loss. In (d), we show how reliable is memory retrieval against stochastic thermal variability. Parameter α is a relative measure of memory capacity. The critical value αc ≃ 0.138 separates the two phases: memory reliability (shaded area) and unreliability (blank area). This transition occurs sharply. Note that this critical value is specific for Hopfield nets; different interaction rules would yield different limitations to memory capacity.
Figure 3.
Figure 3.
Phase transitions in neural dynamics. In a simple version of large-scale dynamics of neural tissues, (a) tissues (such as brain cortex) can be represented as a network of connected neighbouring areas that are connected with excitatory links (adapted from Eckmann et al. [34]). A toy model of this (b) could be represented as a lattice of neural elements connected as a grid with all elements linked to four elements in a homogeneous fashion. The analysis of this system reveals a phase transition from zero activity to high-activity by crossing a critical value of average connections at 〈kc = 1/J (c). A potential function can be obtained where the two phases are revealed as stable states of V(A) (d). Here, large fluctuations show clear dominance around the critical point.
Figure 4.
Figure 4.
Ant colonies as excitable neural nets. In some ant species, such as those belonging to the genus Leptothorax (a), oscillations in activity have been recorded (b) revealing a collective synchronization phenomenon (both adapted from Solé [36]). This phenomenon can be described as an excitable neural system, where ants (inset of c) are reduced to a Boolean representation with active and inactive individuals. (c) As the density of ants ρ increases, a phase change occurs at a critical density, separating inactive from active colonies. (d) Potential function associated with the dynamics of these colonies: for densities larger (lower) than ρc, a well-defined minimum is displayed. Closer to criticality, this potential becomes flatter and allows wide fluctuations to occur.
Figure 5.
Figure 5.
Collective decision-making. (a) A two-path experiment allows testing of the mechanisms by which emergent decision-making occurs. The photograph shows an example of a colony that has made a collective decision, as shown by the preferential use of the shortest path. (b) The mathematical analysis of the model associated with this phenomenon shows that two alternative solutions exist associated with the preferential choice of one branch, along with a third one where both branches are used. (c) The parameter space for the simple symmetric case.
Figure 6.
Figure 6.
Neural network model of task allocation in ant colonies. The dynamics of harvester ants in Gordon et al. [69] can be described in terms of virtual ants (a) each carrying a 3-spin internal description, with changes taking place by means of direct pairwise interactions. The total state space is a three-dimensional Boolean cube (b) where we indicate active (observable) tasks in the top of the cube while a lower layer of inactive states is formed by a flip in the first spin (negative for inactive ants). The model exhibits an attractor dynamics with an associated potential (energy) function. (c,d) The potential function is easily found for a two-task system for the specific values of parameters α = 1 and β = 0.1 (c) and β = 0.5 (d).
Figure 7.
Figure 7.
Collective communication dynamics in ant colonies. In (a), we display an agent i and a set of messages reaching it within time τ, all addressed to i while some carrying the + order others the − order. These messages will be integrated according to equation (3.18). On the other hand, (b) shows how interactions via message sending depends on the frequency (or intensity) of messaging between agents, I. Notice that I values decay with distance. Finally, the way that orders are sent by senders (c) depends on yet another set of couplings {ωij ∈ {−, +}}, which determine whether a + or a − order will be dumped into the system depending on the actual state of the sender Si = ±. Schematically, the arrow connecting sender and receptor is blocked (crossed out) for anticorrelated correlation between coupling ωji and sender state Si.
Figure 8.
Figure 8.
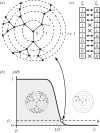
Percolation in immune networks. Idiotypic cascades take place at a network level in the IS. (a) A critical percolation cascading on a Bethe lattice of degree z = 3. Concentric circles delimit successive layers of the cascade. (b) The percolation probability depends on the matching threshold θ. At low threshold values, the system is highly connected, allowing deep penetration across layers, while for high θ, the matching probability decays abruptly, leading to a phase of low connectivity with small-sized cascades. Right in the interface, we have the percolation point. (c) Two strings (eptiope-paratope) of length L = 10 with seven matching pairs and three non-matching pairs. For example, if threshold θ = 5, this particular pair of strings would react, whereas for high fidelity matching (θ = 8), the pair would not connect.
Figure 9.
Figure 9.
The IS as a liquid brain. (a) An interaction between an APC carrying a fragment of an antigen and presenting to a lymphocyte (L). (b) Upon matching, the lymphocyte will react by secreting antibodies with the corresponding matching code, thus flooding the system with its idiotypic information and prompting an idiotypic cascade. (c) A representation of the subjacent idiotypic network operating across the IS. This network is actually self-organized into two major blocks (e) of heavily influential (darker region) and weakly influential (lighter region) nodes. Such an effect can be computationally studied by looking at the strength distribution (d), P(ω), noting that picking a random node from the right/left (strong/weak) (i/j) ends of the spectrum, and then looking at its corresponding next neighbours strength (i¯/j¯), they typically fall under the same category, i.e. strong/weak nodes connect to strong/weak nodes. This suggests a network-like mechanism for tackling the self (S)/non-self (NS) classification problem (ω-axis is depicted in logarithmic scale). Strong nodes are responsible for self-addressed Ab, and vice versa. Part (d) is adapted from Barra & Agliari [, pp. 15–16].
Figure 10.
Figure 10.
Multiscale dynamics in liquid brains. As occurs with many other complex systems, each example of liquid brains involves several scales of description. (a) Ant colonies perform diverse functionalities, such as collective foraging (aiii) on a colony-level basis. At a smaller scale, pairwise interactions among ants take place (aii). Such interactions are localized and, thus, constrained by spatio-temporal properties such as agent mobility or density. At the top of this hierarchy (ai), we encounter single ants as a system. These agents will be defined by a set of rules that drive their behaviour at this minimal scale. (b) A similar scheme can be made for the IS. Scales now involve the idiotypic (or antibody type) network (biii), where information is processed, for instance, at the self/non-self discrimination level (see above). As we zoom in, we encounter the cellular-scale interactions level (bii), which are also associated to the simple-matching recognition dynamics. Finally, yet another level of complexity is reached at the description of the IS elementary agents (bi): viruses, paratopes, epitopes and surface receptors.

References

    1. Hopfield JJ. 1994. Physics, computation and why biology looks so different. J. Theor. Biol. 171, 53–60. (10.1006/jtbi.1994.1211) - DOI
    1. Baluška F, Levin M. 2016. On having no head: cognition throughout biological systems. Front. Psychol. 7, 902 (10.3389/fpsyg.2016.00902) - DOI - PMC - PubMed
    1. Benenson Y. 2012. Biomolecular computing systems: principles, progress and potential. Nat. Rev. Genet. 13, 455–468. (10.1038/nrg3197) - DOI - PubMed
    1. Bray D. 1990. Intracellular signalling as a parallel distributed process. J. Theor. Biol. 143, 215–231. (10.1016/S0022-5193(05)80268-1) - DOI - PubMed
    1. Jablonka E, Lamb MJ. 2006. The evolution of information in the major transitions. J. Theor. Biol. 239, 236–246. (10.1016/j.jtbi.2005.08.038) - DOI - PubMed

Publication types

LinkOut - more resources