

IMPACT: Genomic Annotation of Cell-State-Specific Regulatory Elements Inferred from the Epigenome of Bound Transcription Factors
- PMID: 31006511
- PMCID: PMC6506796
- DOI: 10.1016/j.ajhg.2019.03.012
IMPACT: Genomic Annotation of Cell-State-Specific Regulatory Elements Inferred from the Epigenome of Bound Transcription Factors
Abstract
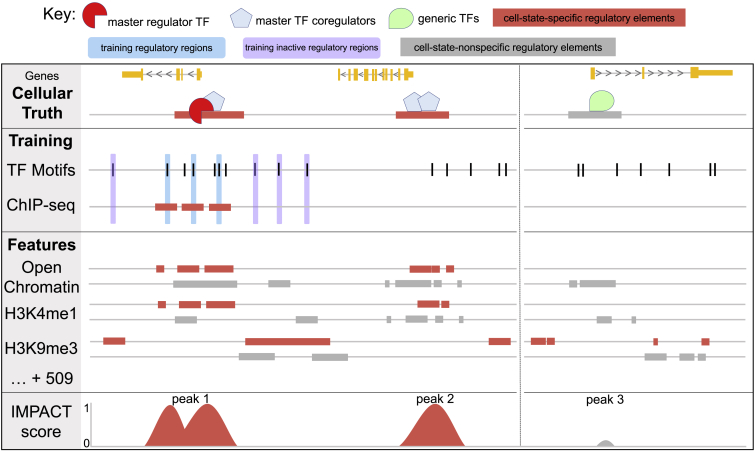
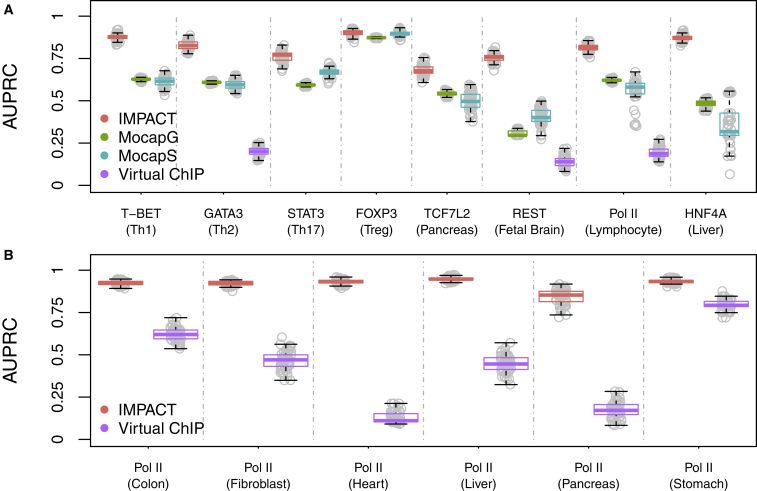
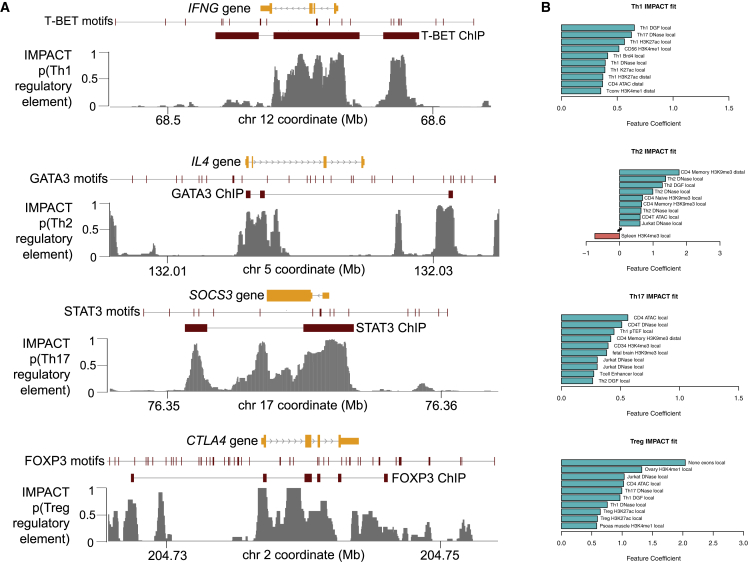
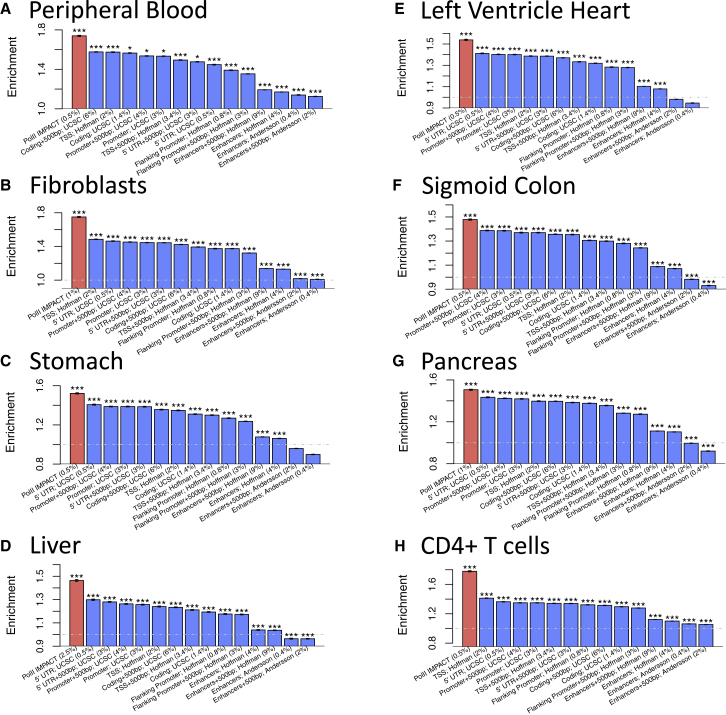
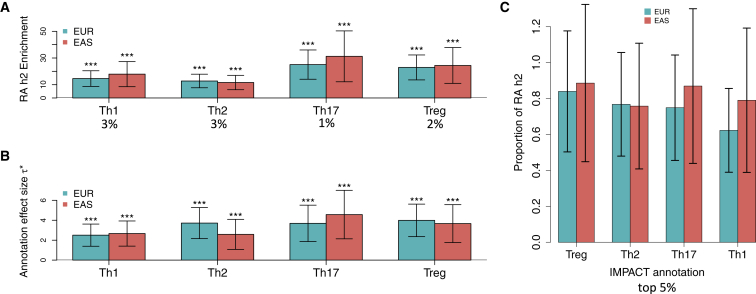
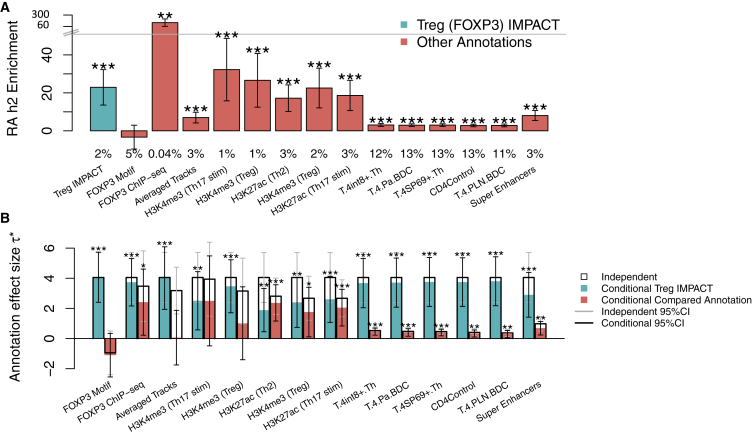
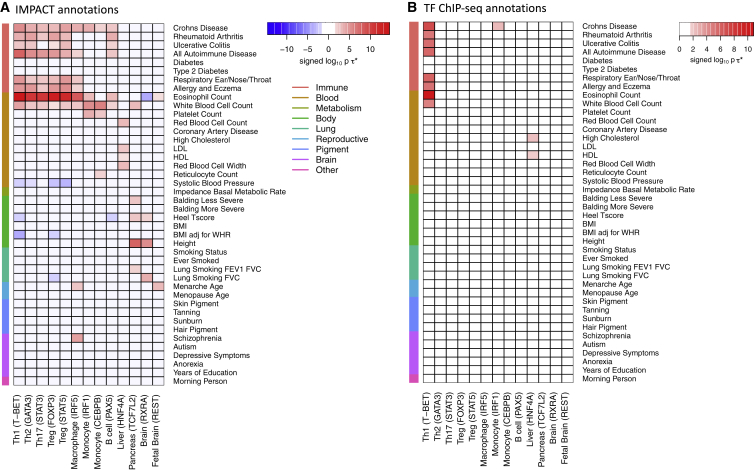
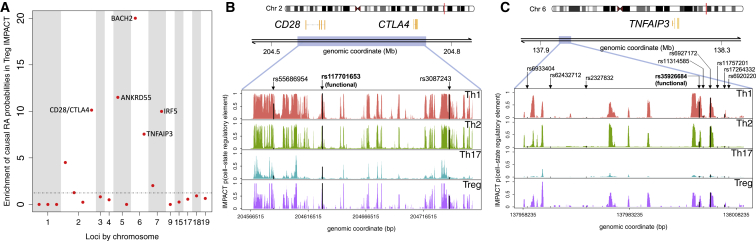
Despite significant progress in annotating the genome with experimental methods, much of the regulatory noncoding genome remains poorly defined. Here we assert that regulatory elements may be characterized by leveraging local epigenomic signatures where specific transcription factors (TFs) are bound. To link these two features, we introduce IMPACT, a genome annotation strategy that identifies regulatory elements defined by cell-state-specific TF binding profiles, learned from 515 chromatin and sequence annotations. We validate IMPACT using multiple compelling applications. First, IMPACT distinguishes between bound and unbound TF motif sites with high accuracy (average AUPRC 0.81, SE 0.07; across 8 tested TFs) and outperforms state-of-the-art TF binding prediction methods, MocapG, MocapS, and Virtual ChIP-seq. Second, in eight tested cell types, RNA polymerase II IMPACT annotations capture more cis-eQTL variation than sequence-based annotations, such as promoters and TSS windows (25% average increase in enrichment). Third, integration with rheumatoid arthritis (RA) summary statistics from European (N = 38,242) and East Asian (N = 22,515) populations revealed that the top 5% of CD4+ Treg IMPACT regulatory elements capture 85.7% of RA h2, the most comprehensive explanation for RA h2 to date. In comparison, the average RA h2 captured by compared CD4+ T histone marks is 42.3% and by CD4+ T specifically expressed gene sets is 36.4%. Lastly, we find that IMPACT may be used in many different cell types to identify complex trait associated regulatory elements.
Keywords: CD4(+); T cells; arthritis; autoimmune; binding; epigenomics; heritability; polygenic; rheumatoid; transcription.
Copyright © 2019 The Author(s). Published by Elsevier Inc. All rights reserved.
Figures
Similar articles
-
Clustered ChIP-Seq-defined transcription factor binding sites and histone modifications map distinct classes of regulatory elements.BMC Biol. 2011 Nov 24;9:80. doi: 10.1186/1741-7007-9-80. BMC Biol. 2011. PMID: 22115494 Free PMC article.
-
Epigenomic elements enriched in the promoters of autoimmunity susceptibility genes.Epigenetics. 2014 Feb;9(2):276-85. doi: 10.4161/epi.27021. Epub 2013 Nov 8. Epigenetics. 2014. PMID: 24213554 Free PMC article.
-
Annotations capturing cell type-specific TF binding explain a large fraction of disease heritability.Hum Mol Genet. 2020 May 8;29(7):1057-1067. doi: 10.1093/hmg/ddz226. Hum Mol Genet. 2020. PMID: 31595288 Free PMC article.
-
Molecular and computational approaches to map regulatory elements in 3D chromatin structure.Epigenetics Chromatin. 2021 Mar 19;14(1):14. doi: 10.1186/s13072-021-00390-y. Epigenetics Chromatin. 2021. PMID: 33741028 Free PMC article. Review.
-
Methods for ChIP-seq analysis: A practical workflow and advanced applications.Methods. 2021 Mar;187:44-53. doi: 10.1016/j.ymeth.2020.03.005. Epub 2020 Mar 30. Methods. 2021. PMID: 32240773 Review.
Cited by
-
Rebooting Regulatory T Cell and Dendritic Cell Function in Immune-Mediated Inflammatory Diseases: Biomarker and Therapy Discovery under a Multi-Omics Lens.Biomedicines. 2022 Aug 31;10(9):2140. doi: 10.3390/biomedicines10092140. Biomedicines. 2022. PMID: 36140240 Free PMC article. Review.
-
Fine-mapping of Parkinson's disease susceptibility loci identifies putative causal variants.Hum Mol Genet. 2022 Mar 21;31(6):888-900. doi: 10.1093/hmg/ddab294. Hum Mol Genet. 2022. PMID: 34617105 Free PMC article.
-
echolocatoR: an automated end-to-end statistical and functional genomic fine-mapping pipeline.Bioinformatics. 2022 Jan 3;38(2):536-539. doi: 10.1093/bioinformatics/btab658. Bioinformatics. 2022. PMID: 34529038 Free PMC article.
-
Colocalization of blood cell traits GWAS associations and variation in PU.1 genomic occupancy prioritizes causal noncoding regulatory variants.bioRxiv [Preprint]. 2023 Mar 30:2023.03.29.534582. doi: 10.1101/2023.03.29.534582. bioRxiv. 2023. Update in: Cell Genom. 2023 May 17;3(7):100327. doi: 10.1016/j.xgen.2023.100327. PMID: 37034747 Free PMC article. Updated. Preprint.
-
The UCSC Genome Browser database: 2025 update.Nucleic Acids Res. 2025 Jan 6;53(D1):D1243-D1249. doi: 10.1093/nar/gkae974. Nucleic Acids Res. 2025. PMID: 39460617 Free PMC article.
References
-
- Lambert S.A., Jolma A., Campitelli L.F., Das P.K., Yin Y., Albu M., Chen X., Taipale J., Hughes T.R., Weirauch M.T. The human transcription factors. Cell. 2018;172:650–665. - PubMed
Publication types
MeSH terms
Substances
Grants and funding
LinkOut - more resources
Full Text Sources
Medical
Research Materials
Miscellaneous
