. 2019 Jun 6;74(5):891-908.e10.
doi: 10.1016/j.molcel.2019.03.034. Epub 2019 Apr 18.

TEX264 Is an Endoplasmic Reticulum-Resident ATG8-Interacting Protein Critical for ER Remodeling during Nutrient Stress

Affiliations

TEX264 Is an Endoplasmic Reticulum-Resident ATG8-Interacting Protein Critical for ER Remodeling during Nutrient Stress

Heeseon An et al. Mol Cell. .

Abstract

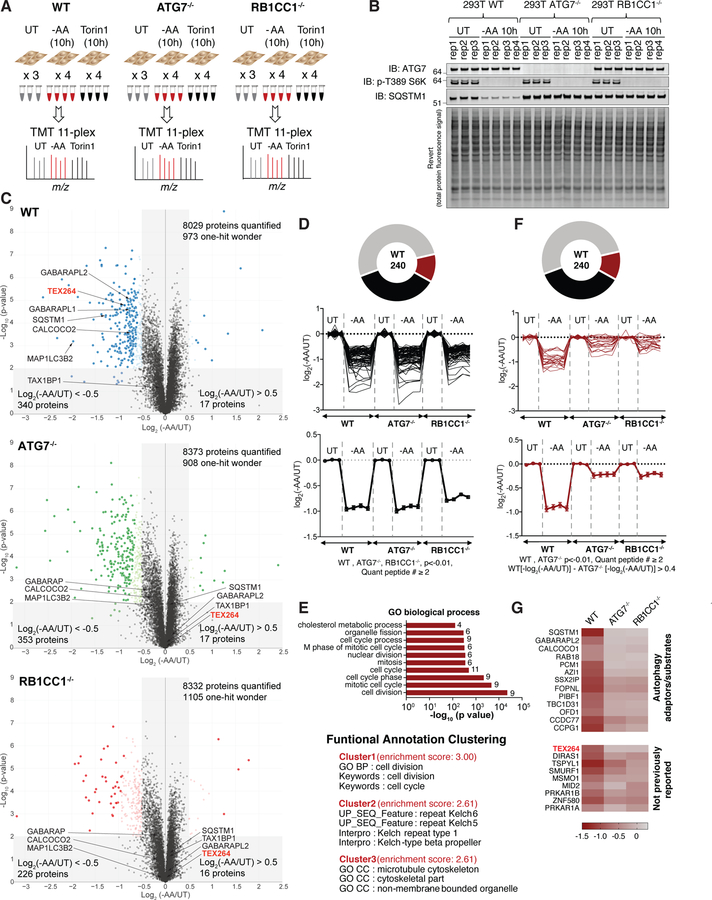
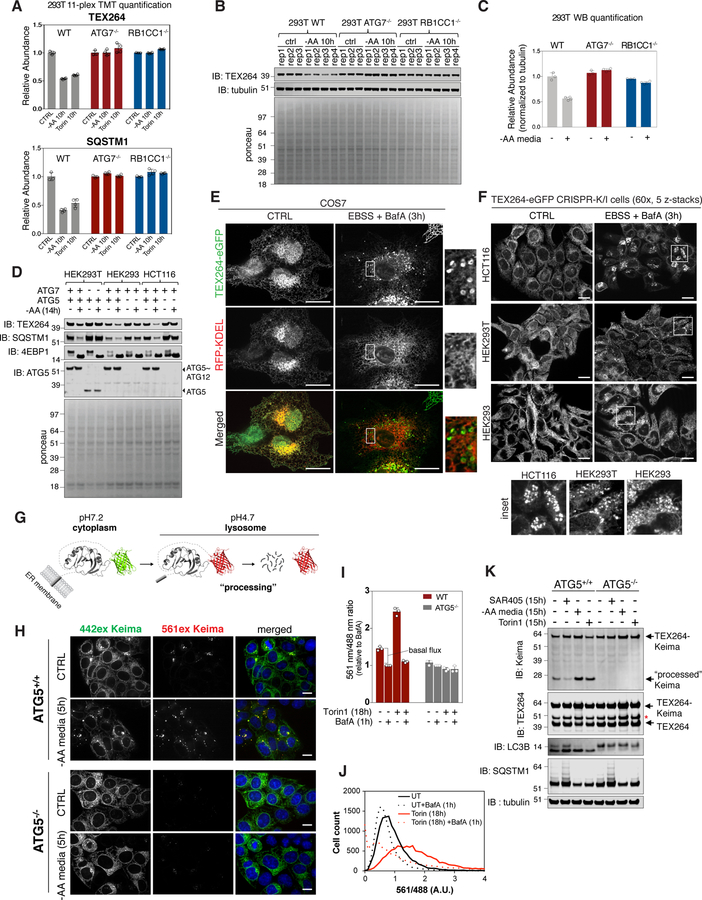
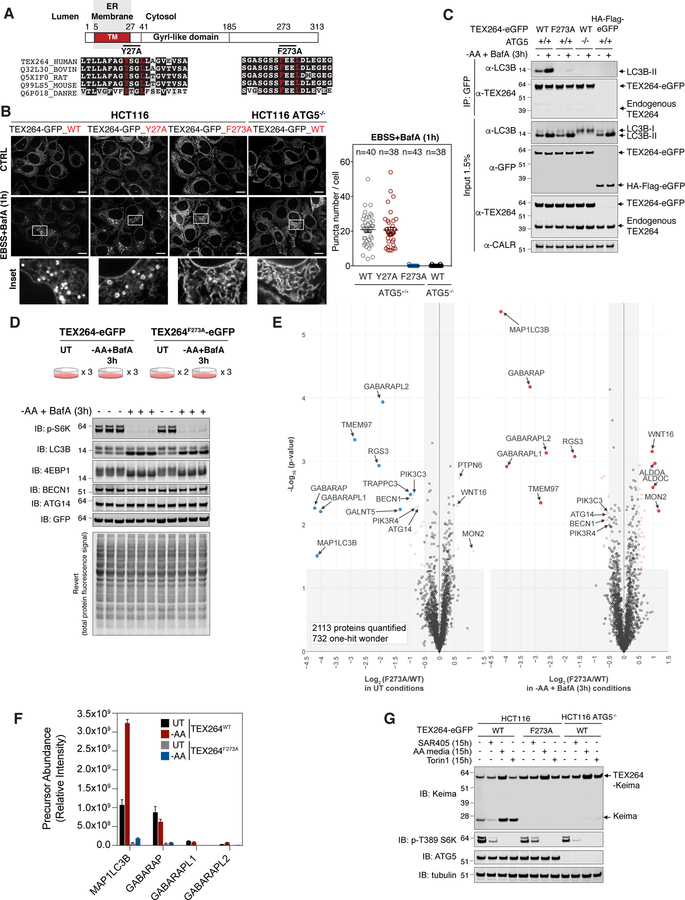
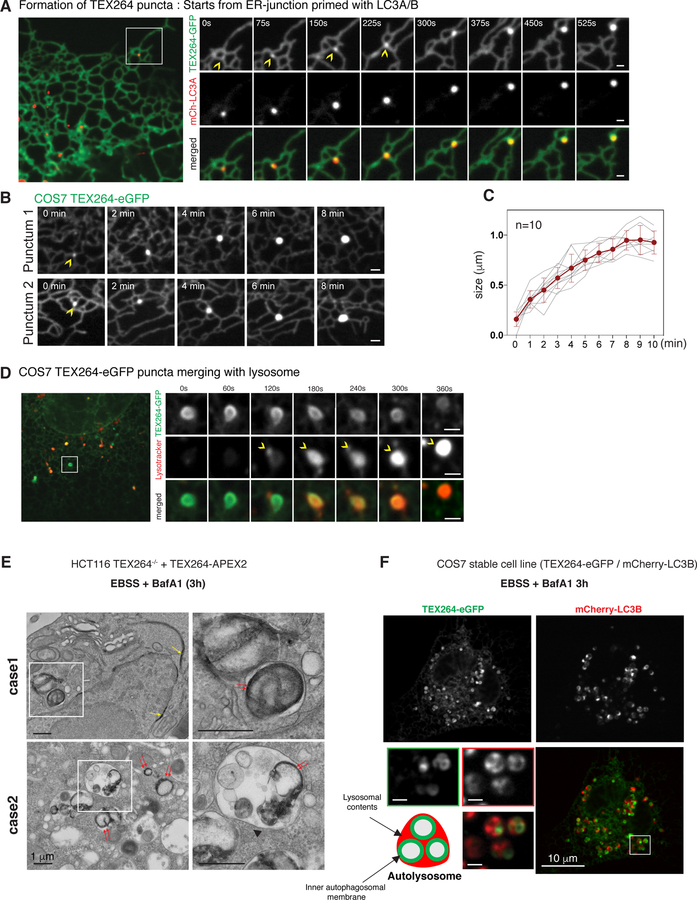
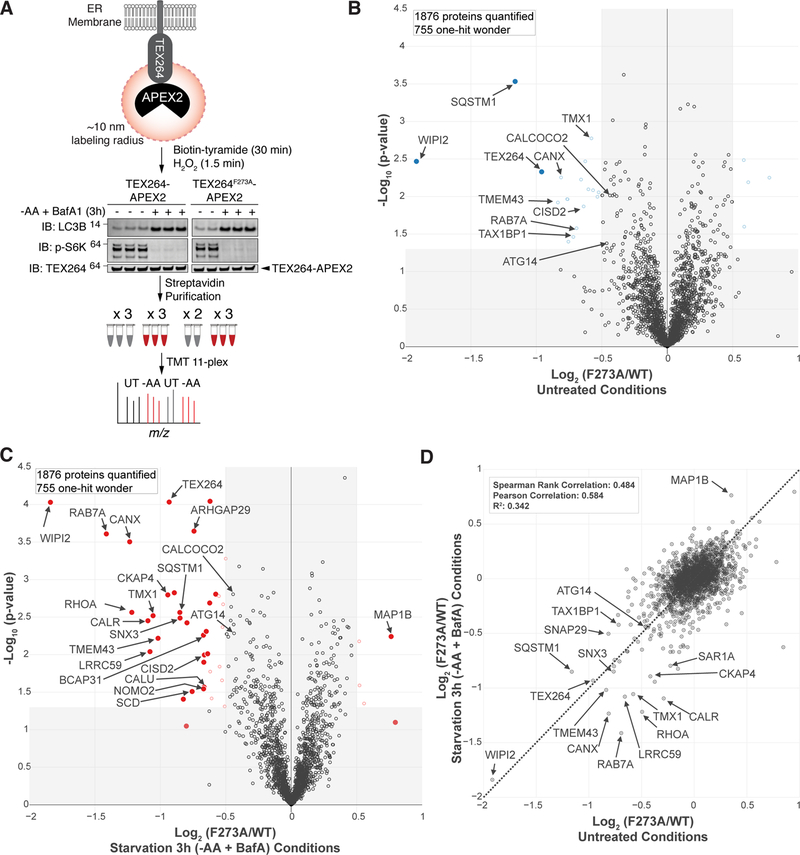
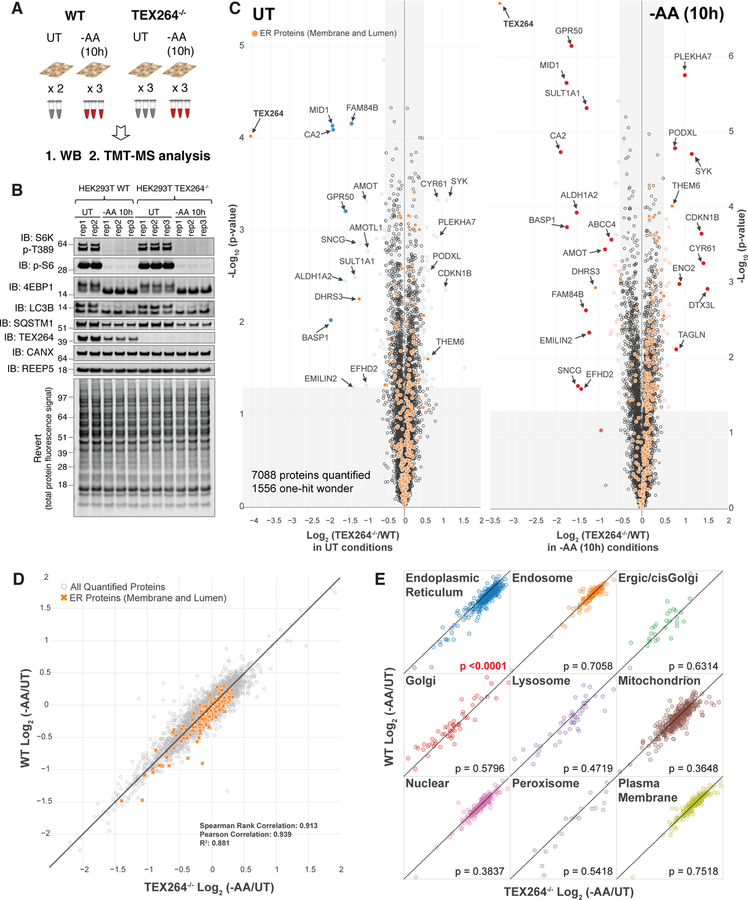
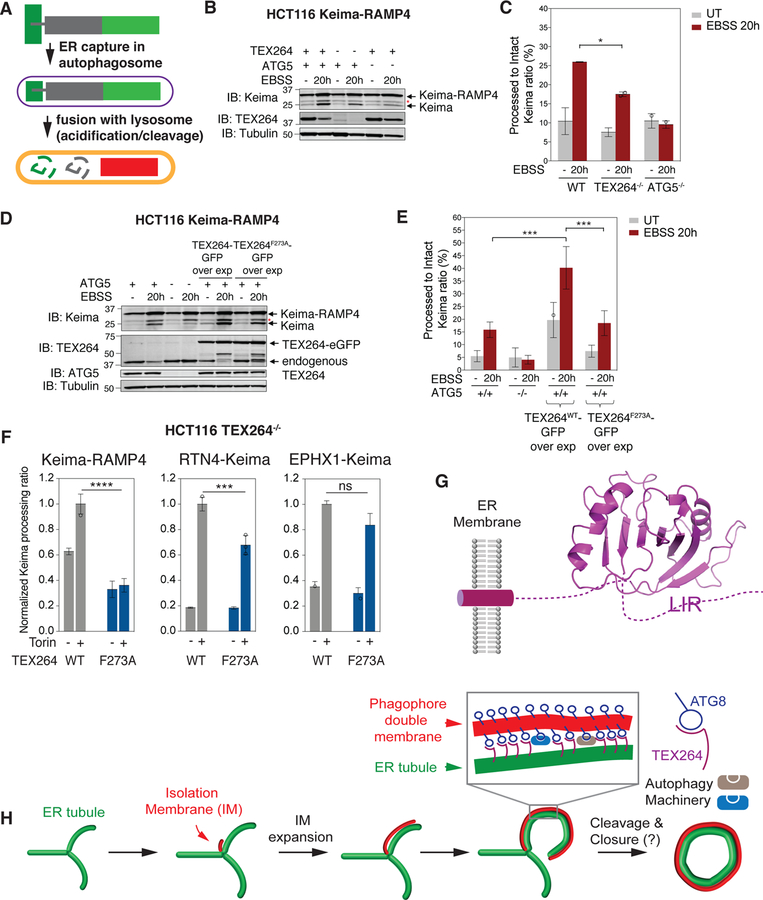
Cells respond to nutrient stress by trafficking cytosolic contents to lysosomes for degradation via macroautophagy. The endoplasmic reticulum (ER) serves as an initiation site for autophagosomes and is also remodeled in response to nutrient stress through ER-phagy, a form of selective autophagy. Quantitative proteome analysis during nutrient stress identified an unstudied single-pass transmembrane ER protein, TEX264, as an ER-phagy receptor. TEX264 uses an LC3-interacting region (LIR) to traffic into ATG8-positive puncta that often initiate from three-way ER tubule junctions and subsequently fuse with lysosomes. Interaction and proximity biotinylation proteomics identified a cohort of autophagy regulatory proteins and cargo adaptors located near TEX264 in an LIR-dependent manner. Global proteomics and ER-phagy flux analysis revealed the stabilization of a cohort of ER proteins in TEX264-/- cells during nutrient stress. This work reveals TEX264 as an unrecognized ER-phagy receptor that acts independently of other candidate ER-phagy receptors to remodel the ER during nutrient stress.

Keywords: ER-phagy; TEX264; selective autophagy.


Conflict of interest statement

DECLARATION OF INTERESTS

J.W.H. is a consultant and founder of Rheostat Therapeutics and a consultant for X-Chem Inc.

Figures

Figure 1.
Figure 1.. Quantitative analysis of cellular proteome remodeling in response to nutrient stress
(A) Overview of quantitative proteomics approach to examine proteome remodeling. The indicated cells were left untreated (UT), or incubated for 10h in media either lacking AAs (−AA) or containing Torin1 (150 nM). Total cell extracts were processed for TMT-MS3 analysis. (B) Immunoblotting of extracts used for TMT proteomics with the indicated antibodies. Lower panel represents the total protein abundance present on immunoblots. (C) Volcano plots (−Log10 p-value versus Log2 ratio of -AA/UT for 293T WT, ATG7−/−, or RB1CC1−/− cells as described in panel A. Proteins with Log2(−AA/UT) < −0.5 or > 0.5 (p-value <0.01) are indicated as colored empty circles, and filled colored circles indicate statistically significant hits (Welch’s t-test (S0 = 0.585), corrected for multiple comparison by permutation-based FDR (5%)). (D) Among 240 proteins with Log2(−AA/UT) value lower than −0.5 in WT HEK293T cells and quantified in all three genotypes with more than one peptide (p < 0.01 in all three), Log2(−AA/UT) values for 82 individual proteins (top) or the average value (lower) whose abundance was reduced (p<0.01) by log2(−AA/UT) < −0.5 across WT, ATG7−/− and RB1CC1−/− cells are indicated. Data are represented as mean ± SEM for triplicate or quadruplicate measurements. (E) Gene ontology (GO) analysis of proteins from panel D. The lower portion of the panel shows the results of Functional Annotation Clustering using the DAVID Bioinformatics Resource V6.8 (https://david.ncifcrf.gov/home.jsp). (F) Log2(−AA/UT) values for 22 individual proteins (top) or the average value (lower) whose abundance was reduced (p<0.01) by log2(−AA/UT) <−0.5 in WT cells but not in ATG7−/− and RB1CC1−/− cells. These 22 proteins showed more than 30% abundance difference between WT and ATG7−/−. Data for RB1CC1−/− is indicated as grey because proteins with p value higher than 0.01 are included in RB1CC1−/− cells. Data are represented as mean ± SEM. (G) Heat map of Log2(−AA/UT) values for 22 individual proteins from panel F. See also Figure S1 and Table S1.
Figure 2.
Figure 2.. TEX264 is a resident ER protein that is degraded by autophagy in response to nutrient deprivation
(A) TMT based quantification of TEX264 and SQSTM1 abundance in 293T cells in response to AA withdrawal (10h) or MTOR inhibition with Torin1 (10h). Data are derived from Table S1. Data are represented as mean ± SD for triplicate or quadruplicate measurements. (B, C) The indicated 293T cells were either left untreated of subjected to AA withdrawal (10h) prior to immunoblotting of cell extracts using the indicated antibodies (panel B). Equal loading of extracts is demonstrated by Ponceau S staining. Data are represented as mean ± SD for triplicate or quadruplicate measurements. (D) The indicated 293T, 293, or HCT116 cells were either left untreated of subjected to AA withdrawal (14h) prior to immunoblotting of cell extracts using the indicated antibodies. (E, F) COS7 cells expressing TEX264-eGFP and RFP-KDEL (panel E) or the indicated cells gene edited to express endogenous TEX264-eGFP (panel F) were either left untreated or subjected to nutrient deprivation (EBSS and BafA, 3h) prior to confocal microscopy. Scale bar in panel E = 20 µm, in panel F = 10 µm. (G) Schematic displaying of the properties of Keima that allow it to be used to monitor flux into the lysosome, where the acidic environment causes an increase in the ratio of 561 nm/488 nm excitation. Once in the lysosome, the Keima fusion protein is “processed” to degrade the fusion protein, but the Keima fragment is resistant to lysosomal proteases and maintains its fluorescence within the lysosome. (H) TEX264-Keima was stably expressed in HCT116 cells with or without ATG5 and sorted by flow-cytometry for equal expression. The cells left untreated or subjected to AA withdrawal (5h) prior to live cell imaging by confocal microscopy. Scale bar = 10 µm. (I,J) Stable HCT116 cells prepared as in panel H were left untreated or subjected to Torin1 (18h) with or without BafA (added 1h before analysis) prior to analysis by flow cytometry to measure the ratio of 561 nm/488 nm excitation in single cells (panel I). A plot of cell count versus fluorescence ration for 561/488 nm is shown in panel J. Data are represented as mean ± SD for triplicate measurements. (K) TEX264-Keima was stably expressed in HCT116 cells with or without ATG5 and cells left untreated or subjected to SAR405, Torin1 or AA withdrawal (15h). Cell extracts were subjected to immunoblotting with the indicated antibodies. The position of processed Keima is shown. Asterisk (red) indicates a band resulting from N-acyl group hydrolysis in Keima chromophore during denaturation, leading to a loss of C-terminus amino acids (18.3 kDa) from intact TEX264-Keima as reported in (An and Harper, 2018). See also Figure S2.
Figure 3.
Figure 3.. TEX264 associates with specific ATG8 family members and is targeted for autophagy through a C-terminal LIR motif
(A) Domain structure of TEX264 showing the transmembrane segment, the GyrI-like domain, and the position of two candidate LIR motifs. The sequences on individual LIR motifs are shown below. (B) The indicated TEX264-eGFP proteins were expressed in HCT116 cells with or without ATG5 and cells either left untreated or treated with EBSS and BafA (1h) prior to imaging by confocal microscopy. Quantification of TEX264-GFP puncta number per cell after starvation is shown in the right panel. Data are represented as mean ± SEM. Scale bar = 10 µm. (C) Lysates from the indicated HCT116 cells with or without ATG5 stably expressing the indicated TEX264-eGFP protein or HA-FLAG-eGFP as a control were subjected to immunoprecipitation with α-GFP antibodies. Immune complexes or whole cell lysates were subjected to immunoblotting with the indicated antibodies. (D) HCT116 TEX264−/− cells were reconstituted with WT or mutant TEX264-eGFP at near endogenous levels followed by clonal selection. Cells were left untreated or subjected to AA withdrawal in the presence of BafA (3h) in duplicate or triplicate and extracts subjected to immunoblotting with the indicated antibodies. (E) Cells from panel D were subjected to α-GFP immunoprecipitation prior to analysis by TMT-MS3. Volcano plots of -Log10(p-value) versus Log2(TEX264F273A/WT) in either untreated conditions or upon AA withdrawal in the presence of BafA (3h) are shown. Proteins with Log2(TEX264F273A/WT ) < −0.5 or > 0.5 (p-value <0.05) are indicated as colored empty circles, and filled colored circles indicate statistically significant hits (Welch’s t-test (S0 = 0.585), corrected for multiple comparison by permutation-based FDR (5%)) (F) Label-free quantification of MS1 precursor ions present in α-GFP immune complexes from panel D (relative intensity). Data are represented as mean ± SD (n=2 or 3, as shown in panel D). (G) The indicated cells were subjected to SAR405 treatment, AA withdrawal or Torin1 treatment for the indicated times and cell extracts subjected to immunoblotting with the indicated antibodies. See also Figure S3 and Table S2.
Figure 4.
Figure 4.. TEX264 accumulates in ATG8-positive punctate structures at ER tubule 3-way junctions followed by fusion with lysosomes
(A) COS7 cells stably expressing TEX264-eGFP and mCherry-LC3A were subjected to confocal imaging during nutrient withdrawal. Time-lapse images of individual regions of the cell cortex containing an LC3B-positive punctate structure located near a ER tubule 3-way junction are shown. Scale bar = 1 µm. Also see Movie S1. (B, C) Examples of time-lapse images showing the accumulation of TEX264-eGFP into puncta over an ~8 min time period (panel B). Quantification of 10 such events is provided in panel C. Data are represented as mean ± SEM (n=10). (D) COS7 cells stably expressing TEX264-eGFP and treated with lysotracker red were subjected to confocal imaging during starvation. Time-lapse images of individual regions of the cell cortex containing a lysotracker red-positive lysosome fusing with a TEX264-eGFP-positive ring-structure are shown. Scale bar = 1 µm. Also see Movie S2. (E) HCT116 TEX264−/− cells expressing TEX264-APEX2 were starved (EBSS) in the presence of BafA for 3h prior to H2O2 and DAB treatment. Cell thin sections were examined by electron microscopy. A region of DAB-positive perinuclear ER is indicated by the yellow arrow. Red arrows indicate DAB staining in autophagosome/autolysosome-like structures. Case 1 employs near endogenous levels of TEX264-APEX2 and Case 2 employs cells transiently expressing TEX264-APEX2. Scale bar = 1 µm. (F) COS7 cells stably expressing TEX264-eGFP and mCherry-LC3B were subjected to confocal imaging during starvation in the presence of BafA (3h). Scale bar in the enlarged images = 1 µm. See also Figure S4 and Movies S1 and S2.
Figure 5.
Figure 5.. Proximity biotinylation identifies autophagy machinery nearby TEX264-APEX2 during capture in autophagosomes
(A) Schematic of proximity biotinylation approach for identification of proteins nearby TEX264-APEX2 during capture in autophagosomes. (B,C) Lysates from cells from panel A were subjected to streptavidin affinity enrichment under denaturating conditions prior to analysis by TMT-MS3. Volcano plots of -Log10(p-value) versus Log2(TEX264F273A-APEX2/TEX264-APEX2WT) in either untreated conditions or upon AA withdrawal in the presence of BafA (3h). Proteins with Log2-Ratio < −0.5 or > 0.5 (p-value <0.05) are indicated as colored empty circles, and filled colored circles indicate statistically significant hits (Welch’s t-test (S0 = 0.585), corrected for multiple comparison by permutation-based FDR (1%)) (D) Comparison of LIR dependent proximity biotinylation targets for TEX264. A plot of Log2(F273A/WT) in untreated cells versus Log2(F273A/WT) in cells upon AA withdrawal in the presence of BafA (3h). See also Figure S4 and Table S2.
Figure 6.
Figure 6.. A role for TEX264 in ER-phagy revealed by quantitative proteomics
(A) Schematic for global proteome analysis of WT and TEX264−/− 293T cells in response to AA withdrawal (10h). Cell extracts were either used for immunoblotting or for TMT-MS3. (B) Lysates from cells from panel A were immunoblotted with the indicated antibodies. (C) Volcano plot of -Log10 (p-value) versus Log2(TEX264−/− vs WT) in 293T cells under untreated conditions (left panel) or under 10h AA withdrawal conditions (right panel). Proteins with Log2-Ratio < −0.5 or > 0.5 (p-value <0.05) are indicated as colored empty circles, and filled colored circles indicate statistically significant hits (Welch’s t-test (S0 = 1), corrected for multiple comparison by permutation-based FDR (1%)). ER marker proteins are in orange. (D) Correlation plot of data in panel C. (E) Correlation plots (data from panel C) for nine organelle categories (material and methods). Results (p-value) of a two-tailed Mann-Whitney t-test comparing Log2(−AA/UT) between TEX264WT and TEX264−/− cell line is indicated for each organelle. See also Figure S5, S6 and Table S3.
Figure 7.
Figure 7.. TEX264 status determines ER-phagic flux
(A) Schematic of Keima-RAMP4 as a reporter for ER-phagy. See text for details. (B, C) Cells lacking TEX264 display reduced ER-phagic flux. HCT116 WT or TEX264−/− cells expressing the Keima-RAMP4 ER-phagy reporter were either left untreated or subjected to starvation (EBSS, 20h) and cell extracts analyzed for Keima-RAMP4 and “processed” Keima using immunoblotting (panel B). Quantification (Odyssey) of immunoblot signals from duplicate experiments are shown in panel C. Data are represented as mean ± SD for duplicate experiments. Asterisk (red) indicates a band resulting from N-acyl group hydrolysis in Keima chromophore during denaturation, leading to a loss of N-terminus amino acids (6.7 kDa) from intact Keima-RAMP4 protein. (D, E) Overexpression of TEX264 promotes ER-phagy. HCT116 cells (WT or ATG5−/−) expressing Keima-RAMP4 and either TEX264-eGFP or TEX264F273A-eGFP were left untreated or subjected to starvation (EBSS, 20h). Cell extracts were examined for Keima-RAMP4 and “processed” Keima by immunoblotting (panel D). Quantification (Odyssey) of immunoblot signals from triplicate experiments are shown in panel E. Data are represented as mean ± SD for triplicate experiments. (F) Histogram showing the relative abundance of processed Keima derived from either Keima-RAMP4, RTN4-Keima or EPHX1-Keima in response to MTOR inhibition (16h) (SD, n=3). (G) Model for TEX264 in the ER membrane. The structure of the GyrI-like domain was predicted based on Swiss-model based molecular modeling (see STAR METHODS). (H) Working model for capture of TEX264-positive ER. The red structure is the isolation membrane (IM) and extends through incorporation of vesicles. Expansion of the IM then allows interaction of ATG8 proteins (primarily LC3A and B) on the phagophore with TEX264 on nearby ER tubules. The interaction of ATG8 proteins with TEX264 may be analogous to a “zipper” allowing the ER membrane to come into close contact with the inner phagophore membrane through a trans interaction. Precisely how the IM is cleaved from the ER and how ER tubules may be cleaved is unknown. See also Figure S7 and Table S4. p****< 0.0001, p***<0.001, p*<0.1

Comment in

Similar articles

Cited by

References

    1. An H, and Harper JW (2018). Systematic analysis of ribophagy in human cells reveals bystander flux during selective autophagy. Nat Cell Biol 20, 135–143. - PMC - PubMed
    1. Anantharaman V, and Aravind L (2004). The SHS2 module is a common structural theme in functionally diverse protein groups, like Rpb7p, FtsA, GyrI, and MTH1598/TM1083 superfamilies. Proteins 56, 795–807. - PubMed
    1. Anding AL, and Baehrecke EH (2017). Cleaning House: Selective Autophagy of Organelles. Dev Cell 41, 10–22. - PMC - PubMed
    1. Dikic I (2018). Open questions: why should we care about ER-phagy and ER remodelling? BMC Biol 16, 131. - PMC - PubMed
    1. Fumagalli F, Noack J, Bergmann TJ, Cebollero E, Pisoni GB, Fasana E, Fregno I, Galli C, Loi M, Solda T, et al. (2016). Translocon component Sec62 acts in endoplasmic reticulum turnover during stress recovery. Nat Cell Biol 18, 1173–1184. - PubMed

Publication types

MeSH terms