. 2019 Jun 5;102(5):1053-1065.e4.
doi: 10.1016/j.neuron.2019.03.033. Epub 2019 Apr 18.

A Common Neuroendocrine Substrate for Diverse General Anesthetics and Sleep

Affiliations

A Common Neuroendocrine Substrate for Diverse General Anesthetics and Sleep

Li-Feng Jiang-Xie et al. Neuron. .

Abstract

How general anesthesia (GA) induces loss of consciousness remains unclear, and whether diverse anesthetic drugs and sleep share a common neural pathway is unknown. Previous studies have revealed that many GA drugs inhibit neural activity through targeting GABA receptors. Here, using Fos staining, ex vivo brain slice recording, and in vivo multi-channel electrophysiology, we discovered a core ensemble of hypothalamic neurons in and near the supraoptic nucleus, consisting primarily of neuroendocrine cells, which are persistently and commonly activated by multiple classes of GA drugs. Remarkably, chemogenetic or brief optogenetic activations of these anesthesia-activated neurons (AANs) strongly promote slow-wave sleep and potentiates GA, whereas conditional ablation or inhibition of AANs led to diminished slow-wave oscillation, significant loss of sleep, and shortened durations of GA. These findings identify a common neural substrate underlying diverse GA drugs and natural sleep and reveal a crucial role of the neuroendocrine system in regulating global brain states. VIDEO ABSTRACT.

Keywords: activity-dependent labeling; general anesthesia; neuroendocrine cells; sleep.


Conflict of interest statement

DECLARATION OF INTERESTS

The authors declare no competing interests.

Figures
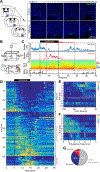
Figure 1.
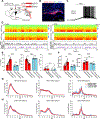
Figure 1.. Discovery of General-Anesthesia-Activated Neurons (AAN) in Hypothalamus.
(A) Left, schematics of interested regions on the brain atlas. A, anterior; P, posterior. Right, representative patterns of Fos+ neurons (approximately 0 mm to −1.2 mm from bregma) after 2-hour control (oxygen) versus isoflurane exposure (1~1.2% Isoflurane mixed with oxygen) from n = 4 pairs of mice. (B-G) Simultaneous in vivo extracellular recording of hypothalamic neurons in the AAN region and the brain states before, during, and after GA. n = 89 neurons across 14 sessions from 7 mice. (B) Schematics of recording chamber and electrode placement. Iso, isoflurane; PFC, prefrontal cortex; EMG, electromyography; Gnd, ground. (C) Representative isoflurane-suppressed (Iso-Sup.) and isoflurane-activated (Iso-Act.) neuron. Top two panels, spike-rate of the example neuron; third, frontal cortex LFP (fLFP); bottom, EMG. Black dashed lines mark the duration of isoflurane exposure. Red dashed lines indicate the period of loss-of-consciousness (LOC). (D) Activity profile of all neurons recorded (n = 89). The spike rate of each neuron was normalized by its peak firing rate. (E-F) Activities of isoflurane-activated neurons (raw spike trains convolved with 1-s Gaussian kernel) aligned with the time when mice lose consciousness (E) or emerge from GA (F). Purple square highlights the neurons that increased firing rate before LOC (E), or decreased firing rate ahead of emergence (F). (G) Categorize the neuronal population based on its response toward isoflurane. See also Figures S1 and S2
Figure 2.
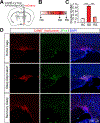
Figure 2.. Molecular Signatures of AAN.
(A) Experimental procedure of two-color in situ hybridization on AAN. vGat, vesicular GABA transporter; vGlut2, vesicular glutamate transporter 2; AVP, arginine vasopressin; Pdyn, prodynorphin; OXT, oxytocin. (B) Representative images of two-color in situ hybridization between Fos (green) that marks AAN and following probes (red): vGat, vGlut2, AVP, Pdyn, OXT, and Galanin. Arrow, open arrowhead and solid arrowhead indicating double+, probe+ only and Fos+ only cells, respectively. (C) Pie chart of percentage of AAN (Fos+) colocalized with each probe in SON and paraSON region. Neurons were from 7–23 sections from 2–3 mice for each pair of condition. See also Figure S3
Figure 3.
Figure 3.. A Shared Neuronal Population is Activated by Different Anesthetics.
(A) Schematic diagram of CANE technology. (B) Viral construct and injection site in FosTVA mice. (C) Illustration of the SON and paraSON. paraSON is defined as a region within 500 μm radius circle with the up-corner of the optic chiasm/tract as the center, extending from anterior to posterior hypothalamus. (D) Left panels, representative images of CANE-captured isoflurane-activated neurons (red) and Fos+ neurons (green) induced by re-exposure to either isoflurane again, or to Propofol, Ketamine (plus xylazine), or dexmedetomidine (Dex). Right panels, pie charts showing the percentage of initial CANE-captured isoflurane-activated neurons that are re-activated (Fos+) by different anesthetics in SON as well as in paraSON. Neurons were from 7–30 slices from 2–4 mice for each condition. (E) Whole-cell patch-clamp recording of CANE-captured isoflurane-activated neurons in acute brain slices following treatments of different classes of anesthetics. Top, representative membrane potential changes after the application of drugs; bottom, statistical summary for all recorded neurons. n = 11 neurons for isoflurane; n = 32 for Propofol; n = 25 for Ketamine; n = 27 for Dex. Wilcoxon signed-rank tests for all drugs. Data are presented as mean ± s.e.m. **P < 0.01, ***P < 0.001. See also Figure S3
Figure 4.
Figure 4.. Chemogenetic Activation of AAN Significantly Potentiates SWS.
(A) Viral-genetic strategy for expressing hM3Dq-mCherry in AAN, and the layout of EEG/EMG recording. fEEG, frontal EEG; pEEG, parietal EEG; Gnd, ground. (B) Systemic CNO treatment (intraperitoneal injection) induced robust Fos (green) expression in the hM3Dq-mCherry+ (red) neurons. (C) Depolarization of hM3Dq-mCherry+ neurons by CNO in acute brain slice. (D) Representative polysomnographic recording following either saline or CNO treatment in AAN-hM3Dq mouse. Top two panels, representative spectrogram from fEEG and pEEG; third, EMG; bottom, brain state annotated. SWS, slow-wave sleep; REM, rapid-eye movement sleep. (E) Percentage of time spent in SWS, Wake and REM across 2 hours after injection. Two-way repeated measures ANOVA followed by Sidak’s post hoc test. n = 7 mice for hM3Dq-mCherry and n = 4 mice for mCherry group. (F) Bout duration and number of SWS across 2 hours after injection. Two-way repeated measures ANOVA followed by Sidak’s post hoc test. n = 7 mice for hM3Dq and n = 4 mice for mCherry group. (G) Power-frequency analysis across SWS, Wake, and REM from different experimental groups. n = 7 mice for hM3Dq and n = 4 mice for mCherry group. Data are presented as mean ± s.e.m. ***P < 0.001. See also Figures S4 and S5
Figure 5.
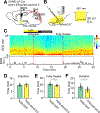
Figure 5.. Brief Optogenetic Activation of AAN Promotes Subsequent SWS.
(A) Viral-genetic strategy for expressing ChR2 in AAN, the layout of optic fiber implantation, and EEG / EMG recording. Gnd, ground. (B) Blue laser evokes reliable neuronal spikes in ChR2+ AAN. (C) Representative polysomnographic recording of AAN-GFP (left panel) and AAN-ChR2 (right panel) mice before, during, and after laser stimulation (10 Hz, 10 ms pulses, 1s-On and 1s-OFF, 3 min, 3~4 mW measured at the fiber tips). Top, representative spectrogram of EEG; middle, EMG; bottom, brain state annotated. (D) Percentage of time spent in SWS (left), Wake (middle), and REM (right) before, during, and after the period of laser stimulation (blue shaded area). n = 28 trials from 5 ChR2 mice (4~6 trials per mouse); n = 24 trials from 4 GFP mice (6 trials per mouse). Permutation test were performed across two groups. Data are presented as mean ± s.e.m. **P < 0.01, ***P < 0.001. See also Figure S6
Figure 6.
Figure 6.. AAN Is Activated by Sleep Pressure
(A) CANE strategy for specifically expressing mCherry in AAN. (B) Time windows for each experimental group. HC, home cage; SD, sleep deprivation; RS, recovery sleep. (C) Total percentage of CANE-captured neurons reactivated under HC, SD, and RS. One-way ANOVA followed by Sidak’s post hoc test. n = 3 mice for HC, n = 4 for SD, n = 3 for RS. (D) Representative Fos staining from HC, SD, and RS. Data are presented as mean ± s.e.m. ***P < 0.001.
Figure 7.
Figure 7.. Ablation of AAN Disrupts Natural Sleep.
(A) Left, viral-genetic strategy for specifically expressing diphtheria toxin receptor (DTR) in AAN and the layout of EEG and EMG electrodes. (B) Left, experimental setup of EEG/EMG recording across day and night. Right, top, experimental design and the timing of DT injection. Right, bottom, representative image of AAN ablation after DT injection. DT, diphtheria toxin; 1W, 1-week after DT; 2W, 2-week after DT. (C) Representative polysomnographic recording before (top) and after (bottom) DT treatment in AAN-DTR mice. (D) Total percentage of time spent in SWS (left), Wake (middle), and REM (right) across 23 hours recording. One-way repeated measures ANOVA followed by Sidak’s post hoc test. n = 9 mice. (E) Average bout duration, bout number and delta power of SWS. One-way repeated measures ANOVA followed by Sidak’s post hoc test. n = 9 mice. (F) Average bout duration, bout number and theta power of REM sleep. One-way repeated measures ANOVA followed by Sidak’s post hoc test. n = 9 mice. Data are presented as mean ± s.e.m. *P < 0.05, **P < 0.01, ***P < 0.001 See also Figure S7
Figure 8.
Figure 8.. Optogenetic Inhibition of AAN Shortens the Duration of GA.
(A) Viral-genetic strategy for expressing eArch3.0 in AAN, the layout of optic fiber implantation, and EEG/EMG recording. Gnd, ground. (B) Yellow light induces a sustained hyperpolarization in eArch3.0+ AAN. (C) Representative EEG/EMG recording across experimental session. Top, spectrogram of EEG; bottom, EMG. Isoflurane (1%) was infused for 10 min. Yellow laser stimulation (5 min square pulse, 5~7 mW measured at the fiber tips) was applied for the first 5 min of Isoflurane infusion. Induction time is identified by occurrence of slow oscillation and reduction of movement. Fully awake time is determined by reduction in slow wave power and raised muscle activity continuously for more than 1 min. (D-F) Statistical analysis of Induction time (D), fully awake time (E), and anesthesia duration (F). n = 7 for AAN-GFP mice, n = 8 for AAN-eArch3.0 mice. Two-sample t-test. Data are presented as mean ± s.e.m., *P < 0.05.

Similar articles

Cited by

References

    1. Akeju O, and Brown EN (2017). Neural oscillations demonstrate that general anesthesia and sedative states are neurophysiologically distinct from sleep. Curr Opin Neurobiol 44, 178–185. - PMC - PubMed
    1. Alkire MT, Hudetz AG, and Tononi G (2008). Consciousness and anesthesia. Science 322, 876–880. - PMC - PubMed
    1. Bellavance MA, Takatoh J, Lu J, Demers M, Kleinfeld D, Wang F, and Deschenes M (2017). Parallel Inhibitory and Excitatory Trigemino-Facial Feedback Circuitry for Reflexive Vibrissa Movement. Neuron 95, 722–723. - PubMed
    1. Betley JN, Xu S, Cao ZFH, Gong R, Magnus CJ, Yu Y, and Sternson SM (2015). Neurons for hunger and thirst transmit a negative-valence teaching signal. Nature 521, 180–185. - PMC - PubMed
    1. Bjorness TE, and Greene RW (2009). Adenosine and sleep. Curr Neuropharmacol 7, 238–245. - PMC - PubMed

Publication types

MeSH terms