. 2019 Jun 4;29(6):1291-1305.e8.
doi: 10.1016/j.cmet.2019.03.014. Epub 2019 Apr 18.

Pyruvate-Carboxylase-Mediated Anaplerosis Promotes Antioxidant Capacity by Sustaining TCA Cycle and Redox Metabolism in Liver

Affiliations

Pyruvate-Carboxylase-Mediated Anaplerosis Promotes Antioxidant Capacity by Sustaining TCA Cycle and Redox Metabolism in Liver

David A Cappel et al. Cell Metab. .

Abstract

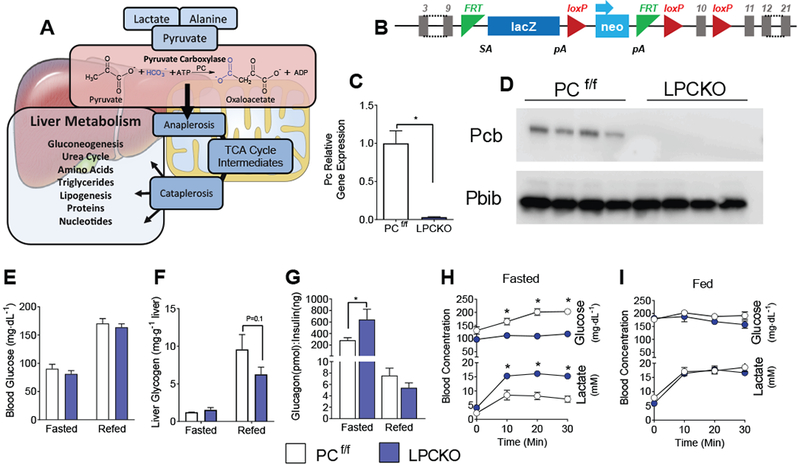
The hepatic TCA cycle supports oxidative and biosynthetic metabolism. This dual responsibility requires anaplerotic pathways, such as pyruvate carboxylase (PC), to generate TCA cycle intermediates necessary for biosynthesis without disrupting oxidative metabolism. Liver-specific PC knockout (LPCKO) mice were created to test the role of anaplerotic flux in liver metabolism. LPCKO mice have impaired hepatic anaplerosis, diminution of TCA cycle intermediates, suppressed gluconeogenesis, reduced TCA cycle flux, and a compensatory increase in ketogenesis and renal gluconeogenesis. Loss of PC depleted aspartate and compromised urea cycle function, causing elevated urea cycle intermediates and hyperammonemia. Loss of PC prevented diet-induced hyperglycemia and insulin resistance but depleted NADPH and glutathione, which exacerbated oxidative stress and correlated with elevated liver inflammation. Thus, despite catalyzing the synthesis of intermediates also produced by other anaplerotic pathways, PC is specifically necessary for maintaining oxidation, biosynthesis, and pathways distal to the TCA cycle, such as antioxidant defenses.

Keywords: TCA cycle; anaplerosis; gluconeogenesis; high-fat diet; liver physiology; metabolic flux; oxidative stress; pyruvate carboxylase; urea cycle.


Conflict of interest statement

Declaration of Interests

The authors declare no competing interests.

Figures

Figure 1:
Figure 1:. Authentication and phenotyping of LPCKO mice.
A) Pathway illustrating the role of pyruvate carboxylase in anaplerotic flux. B) Schematic of construct used in LCPKO mice showing locations of loxP sites within the Pyruvate Carboxylase gene. C) Gene expression for pyruvate carboxylase normalized to Ppib (cyclophilin B) from livers of PCf/f and LPCKO mice; n=4. D) Western blot for PC (alpha-Pcb) and cyclophilin B (Ppib) from liver protein extract; n=4. E) Blood glucose levels in the fasted and refed state; n=4. F) Liver glycogen concentration in fasted and fed mice; n=4. G) Glucagon to insulin ratio in the fasted and refed state; n=4. Blood glucose and lactate in the H) fasted and I) refed state following a 1.5 mg/g body weight lactate-pyruvate tolerance test. Data expressed as mean ± SEM. * indicates p<.05 by Student’s t-test or 2-way ANOVA. See also Figure S1.
Figure 2:
Figure 2:. Liver specific PC loss prevents hepatic gluconeogenesis and activates renal gluconeogenesis.
Mass enrichments in A) plasma glucose and B) plasma lactate following a [U-13C]glucose infusion in conscious unrestrained mice after an overnight fast. Rates of C) in vivo glucose production and D) gluconeogenesis determined from glucose and lactate enrichments. E) Hepatic glucose production by isolated perfused livers from overnight fasted mice; n=5-6. F) Representative 2H NMR spectra from mono-acetone glucose derived from glucose produced by PC f/f and LPCKO livers. G) Hepatic gluconeogenesis from the TCA cycle by the isolated perfused liver determined from 2H glucose enrichments. H) Effect of supplementing liver perfusions with 1mM glutamine or propionate. I) Expression of genes whose products control gluconeogenesis and glucose uptake normalized to cyclophilin B in kidney of 18-hour fasted mice. J) Mass enrichments in kidney oxaloacetate after [U-13C]glucose infusion; n=4. K) M+3 enrichment in kidney TCA cycle intermediates after a [U-13C]lactate/pyruvate injection; n=3-4. Data expressed as mean ± SEM. * indicates p<.05 by Student’s t-test or 2-way ANOVA. See also Figure S2.
Figure 3:
Figure 3:. Loss of PC disrupts hepatic amino acid catabolism
A) Concentrations of alanine, glutamine, glutamate as determined by mass spectrometry in snap frozen livers from overnight fasted mice; n=5-7. B) Concentrations of urea cycle intermediates and related amino acids; n=5-7. C) Expression of genes whose products contribute to urea cycle function normalized to cyclophilin b; n=4. D) Ratio of urea to creatinine in urine collected from ad lib fed mice; n=5-6. E) Concentration of ammonia in the plasma of overnight fasted mice; n=4. F) Rate of urea production in liver perfusion from 18-hour fasted mice using substrate with lactate/pyruvate or 1mM aspartate supplementation; n=4. G) Rate of urea production in liver perfusion from overnight fasted mice using substrate with lactate/pyruvate or 1mM glutamate supplementation. n=4 H) Schematic illustrating the effects of LPCKO on hepatic urea cycle. Data expressed as mean ± SEM. * indicates p<.05 by Student’s t-test. See also Figure S3.
Figure 4:
Figure 4:. Loss of PC suppresses TCA cycle function but maintains β-oxidation by activation of ketogenesis.
A) Concentrations of lactate and pyruvate in livers of overnight fasted mice as determined by mass spectrometry; n=5-7. B) Concentrations of TCA cycle intermediates in livers of overnight fasted mice as determined by mass spectrometry; n=5-7. Relative concentrations of M+3 labeled C) malate and D) oxaloacetate following a [U-13C]lactate/pyruvate injection; n=4. E) Determination of M+2 acetyl-CoA oxidation in the TCA cycle as an estimate of PDH activity; n=4. F) Representative 13C NMR spectra of the C2 position of mono-acetone glucose derived from glucose produced by perfused PCf/f and LPCKO livers from overnight fasted mice. G) Rate of production of glucose isotopomers with 13C labeling in carbons 1, 2 and 3, where filled circles represent 13C; n=5-6. Calculated rates of H) anaplerosis and I) TCA cycle turnover based on glucose isotopomer formation in isolated perfused liver; n=5-6. J) Oxygen consumption of perfused livers; n=5-6. K) Gene expression for genes whose products control fatty acid oxidation normalized to cyclophilin B; n=4-6. L) Plasma triglyceride levels in 18 hour fasted and 4 hours following re-feeding after an 18 hour fast conditions; n=7-10 fasted 4-5 refed. M) Liver triglyceride content in overnight fasted mice; n=6. N) Plasma total ketones in overnight fasted and 4 hours following re-feeding after 18 hour fast conditions; n=4. O) Ketone production as determined by perfusion of livers from 18-hour fasted mice; n=5-7. P) β-Oxidation determined by flux balance analysis of data from isolated perfused liver; n=5-7. Q) Schematic illustrating the effect of LPCKO on hepatic TG and ketone body metabolism. Data expressed as mean ± SEM. * indicates p<.05 by Student’s t-test. See also Figure S4.
Figure 5:
Figure 5:. Loss of PC reduces hepatic energy demand but not mitochondrial respiratory capacity.
A) Citrate synthase activity in livers of PCf/f and LPCKO mice n=6. B) Respiration in functioning isolated perfused liver determined by a flux balance analysis model. C) Concentrations of AMP, ADP, and ATP in the livers of 18-hour fasted PCf/f and LPCKO mice; n=4-5. D) Ratio of ATP to AMP; n=4-5. E) Mitochondrial redox state (NAD+/NADH) indicated by the [aKG][NH4]/[glu] in snap frozen livers of fasted mice.; n=4-5. F) Oxygen consumption measured by Seahorse of isolated mitochondria from PCf/f and LPCKO livers using 10 mM pyruvate and 5mM malate as substrate; n=4. G) Schematic illustrating the effect of LPCKO on hepatic mitochondrial energy metabolism and hepatic energetics. Data expressed as mean ± SEM. * indicates p<.05 by Student’s t-test.
Figure 6:
Figure 6:. LPCKO mice are resistant to HFD induced glucose intolerance but not hepatic steatosis.
A) Blood glucose in 5-hour fasted PCf/f and LPCKO mice fed either chow or 12 weeks of HFD; n=5-7. B) I.P. glucose tolerance test (2mg glucose/g body weight)) in 5-hour fasted chow and 12-week HFD mice; n=5-6. * indicates statistical significance for LPCKO HFD versus PCf/f HFD and † indicates statistical significance versus chow fed PCf/f by two-way repeated measures ANOVA with Tukey multiple comparison test. C) Quantification of Western blot analysis of Akt phosphorylation in response to portal insulin injection in 12-week HFD fed mice (see also Figure S6); n=4. D) Plasma insulin levels in 18-hour fasted PCf/f or LPCKO mice on a HFD for 18 weeks; n=5-7. E) Plasma triglycerides and F) liver triglyceride content in 18-hour fasted mice; n= 5-7. G) Vesicular steatosis measured in images of H&E-stained liver sections taken from 18-hour fasted mice; n=5-7. Data expressed as mean ± SEM. * indicates p<.05 by Student’s t-test. See also Figure S6.
Figure 7:
Figure 7:. Loss of PC predisposes liver to oxidative stress and inflammation.
Expression levels of genes whose products are involved in A) inflammation and B) oxidative stress in 12 and 18-week HFD mice normalized to cyclophilin B; n=4-6. NADPH/NADP+ in snap frozen livers of fasted mice, indicated by C) the malate/pyruvate ratio and the malic enzyme equilibrium constant, or D) total NADP+ and NADPH ratio. E) Total amount of hepatic glutathione in the reduced state; n=4-6. F) Lipid peroxidation measured by the TBARS assay; n=4-6. G) Correlation between hepatic inflammation (IL6 expression) and NADPH/ NADP+ ratio. H) Schematic illustrating the effect of LPCKO on hepatic inflammation and oxidative stress. Data expressed as mean ± SEM. * Indicates p<.05 by Student’s t-test or 2-way ANOVA. Significance of relationship determined by Spearman correlation. See also Figure S7.

Comment in

References

    1. Ahmad A, Kahler SG, Kishnani PS, Artigas-Lopez M, Pappu AS, Steiner R, Millington DS, and Van Hove JL (1999). Treatment of pyruvate carboxylase deficiency with high doses of citrate and aspartate. Am J Med Genet 87, 331–338. - PubMed
    1. Al-Sawaf O, Clarner T, Fragoulis A, Kan YW, Pufe T, Streetz K, and Wruck CJ (2015). Nrf2 in health and disease: current and future clinical implications. Clinical science (London, England : 1979) 129, 989–999. - PubMed
    1. Antoniewicz MR, Kelleher JK, and Stephanopoulos G (2007). Elementary metabolite units (EMU): a novel framework for modeling isotopic distributions. Metabolic engineering 9, 68–86. - PMC - PubMed
    1. Berglund ED, Lee-Young RS, Lustig DG, Lynes SE, Donahue EP, Camacho RC, Meredith ME, Magnuson MA, Charron MJ, and Wasserman DH (2009). Hepatic energy state is regulated by glucagon receptor signaling in mice. Journal of Clinical Investigation 119, 2412–2422. - PMC - PubMed
    1. Bigot A, Tchan MC, Thoreau B, Blasco H, and Maillot F (2017). Liver involvement in urea cycle disorders: a review of the literature. J Inherit Metab Dis 40, 757–769. - PubMed

Publication types

MeSH terms