. 2019 Jun 6;24(6):944-957.e5.
doi: 10.1016/j.stem.2019.03.020. Epub 2019 Apr 18.

Lineage Tracing Reveals a Subset of Reserve Muscle Stem Cells Capable of Clonal Expansion under Stress

Affiliations

Lineage Tracing Reveals a Subset of Reserve Muscle Stem Cells Capable of Clonal Expansion under Stress

Annarita Scaramozza et al. Cell Stem Cell. .

Abstract

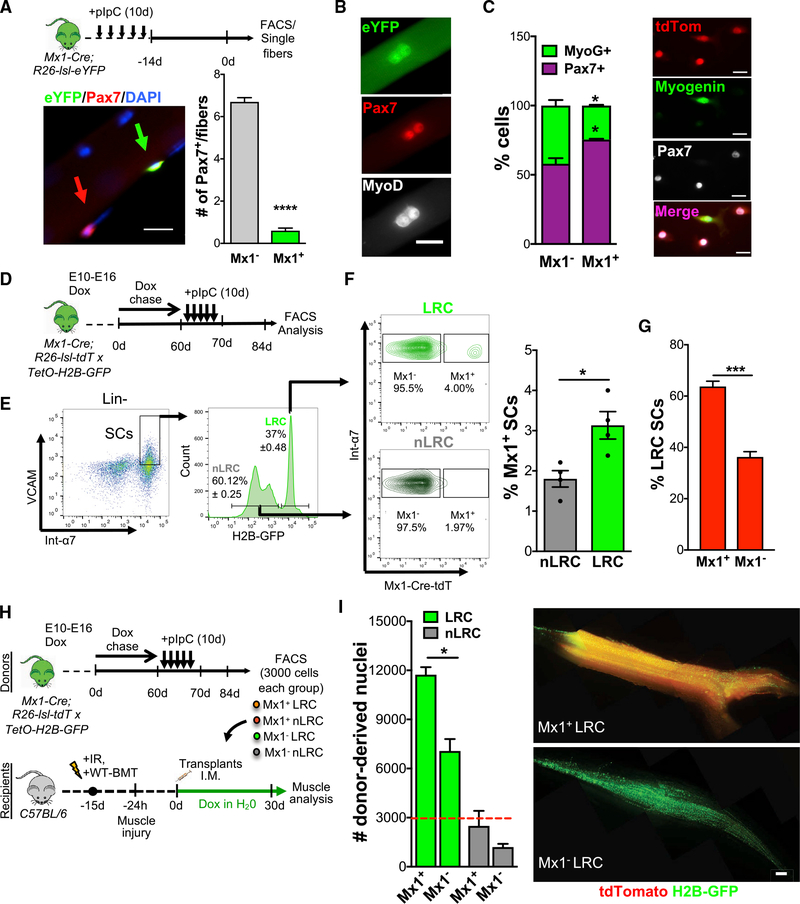
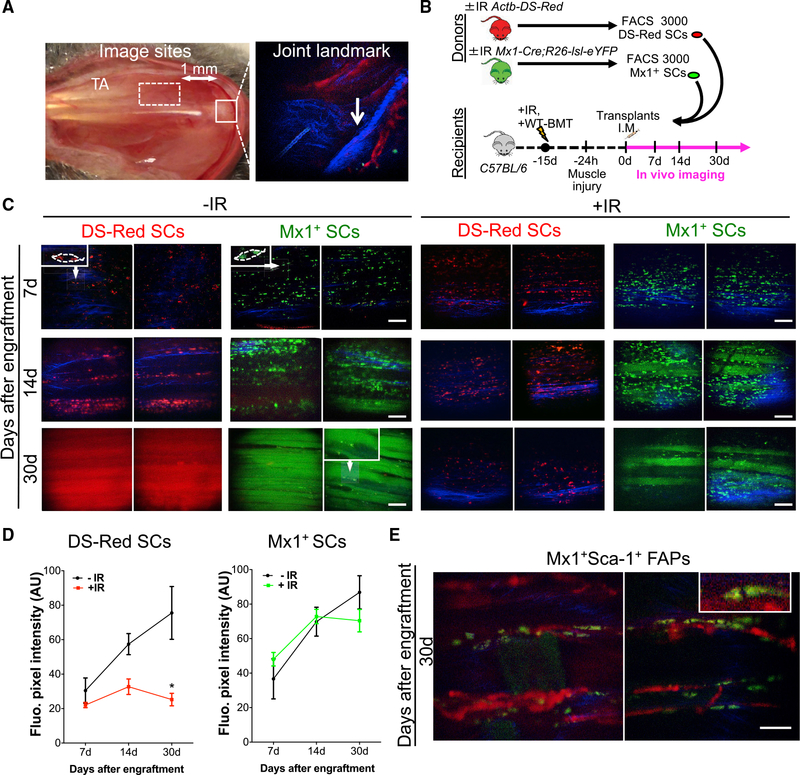
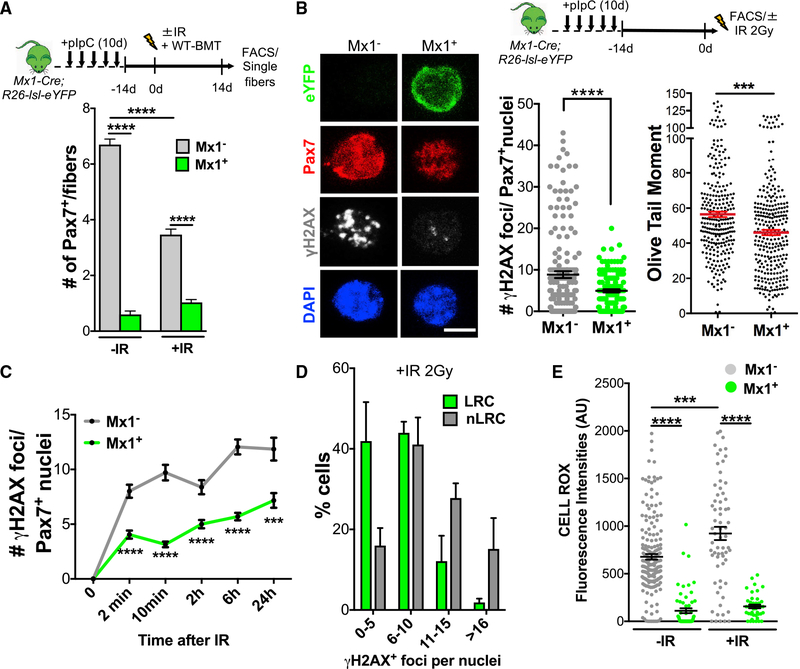
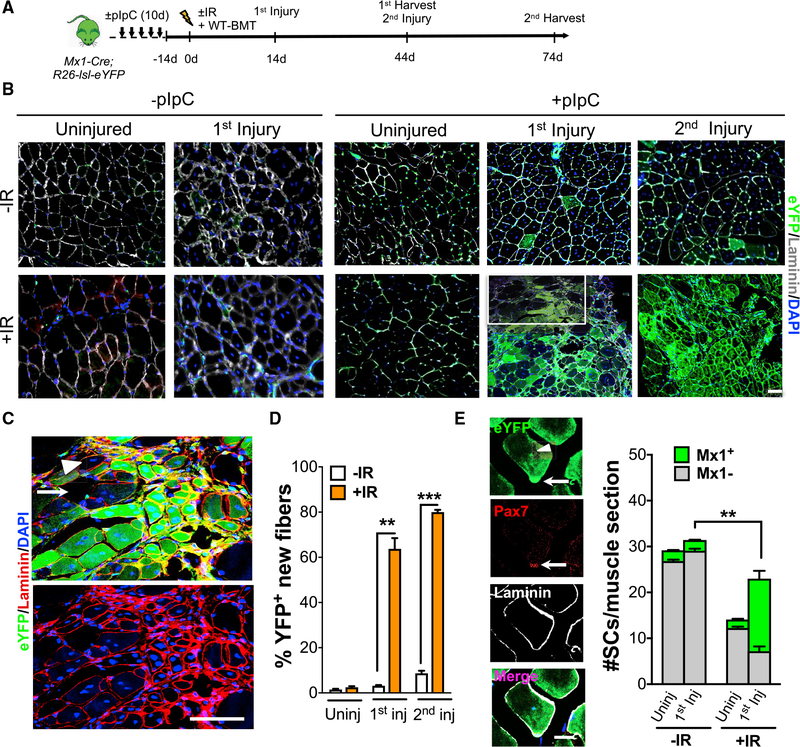
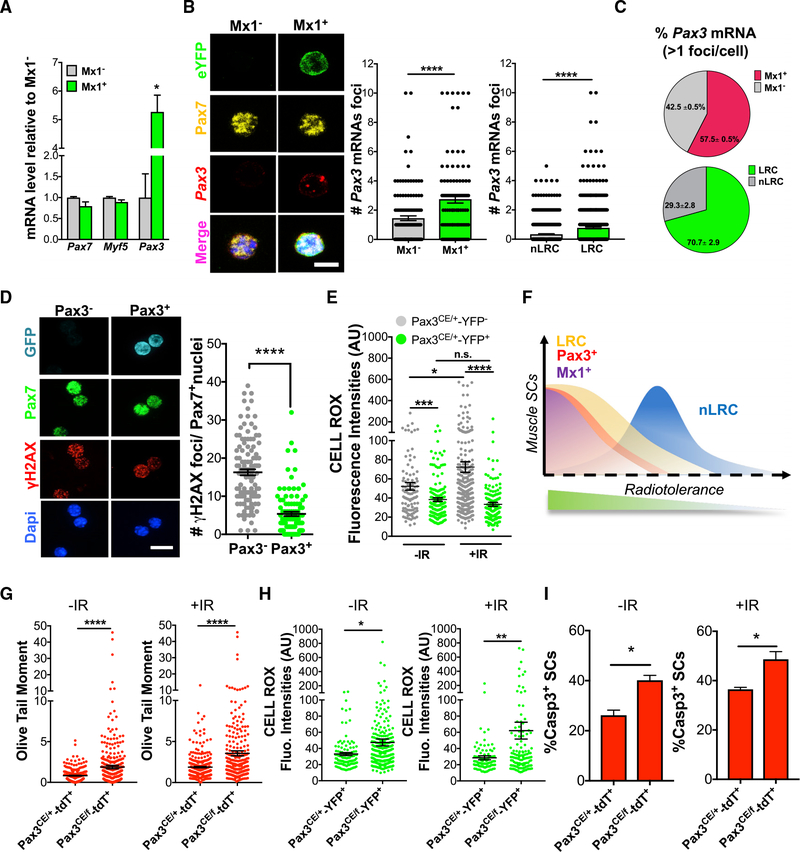
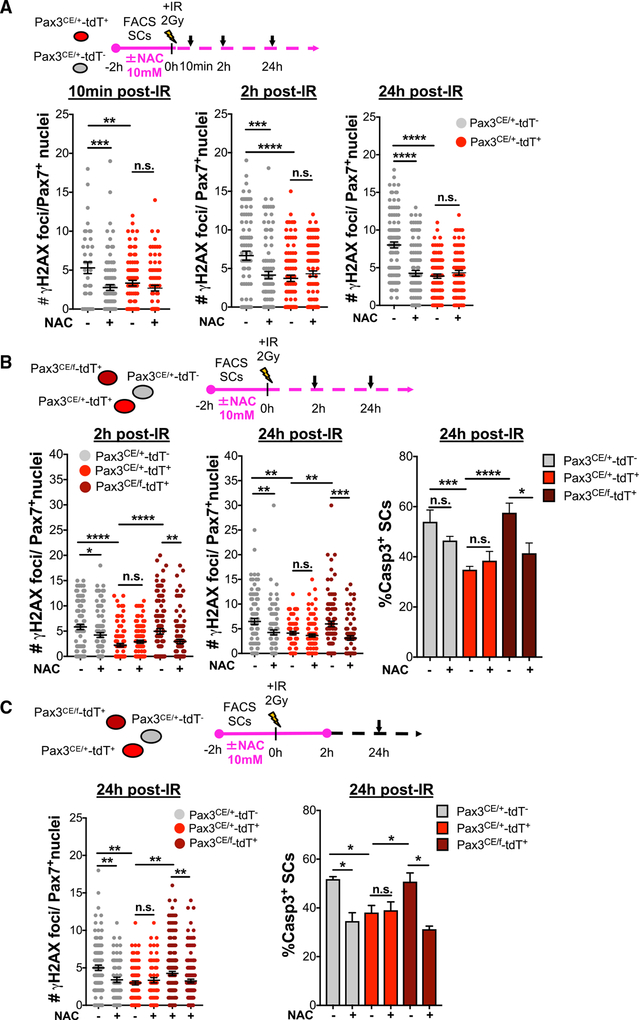
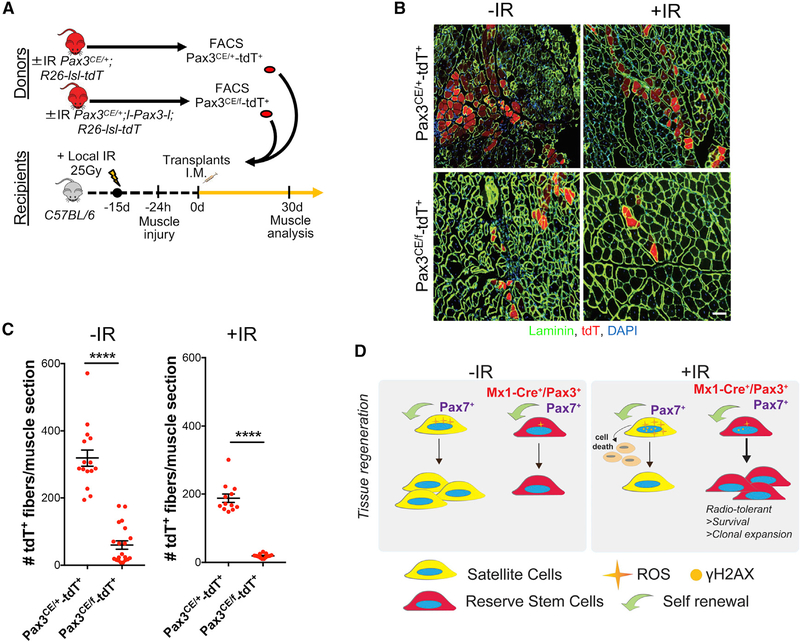
Stem cell heterogeneity is recognized as functionally relevant for tissue homeostasis and repair. The identity, context dependence, and regulation of skeletal muscle satellite cell (SC) subsets remains poorly understood. We identify a minor subset of Pax7+ SCs that is indelibly marked by an inducible Mx1-Cre transgene in vivo, is enriched for Pax3 expression, and has reduced ROS (reactive oxygen species) levels. Mx1+ SCs possess potent stem cell activity upon transplantation but minimally contribute to endogenous muscle repair, due to their relative low abundance. In contrast, a dramatic clonal expansion of Mx1+ SCs allows extensive contribution to muscle repair and niche repopulation upon selective pressure of radiation stress, consistent with reserve stem cell (RSC) properties. Loss of Pax3 in RSCs increased ROS content and diminished survival and stress tolerance. These observations demonstrate that the Pax7+ SC pool contains a discrete population of radiotolerant RSCs that undergo clonal expansion under severe stress.

Keywords: Mx1; Pax3; ROS; clonal expansion; muscle stem cells; radiation; reserve stem cell; satellite cells; stress; tissue regeneration.


Conflict of interest statement

DECLARATION OF INTERESTS

The authors declare no competing interests.

Figures

Figure 1.
Figure 1.. Mx1-Cre Marks a Subset of Pax7+ SCs
(A) Scheme of pIpC injection, FACS, and single muscle fiber harvesting for Mx1-Cre;R26-lsl-eYFP mice (top). Single muscle fiber stained for eYFP and Pax7 (left) and number of Mx1+ and Mx1Pax7+ SCs/muscle fiber (right) is shown. Mx1+ (green arrow) and Mx1(red arrow) SCs (n = 4−6 mice) are shown. (B) Mx1+ SCs on single muscle fibers after 48 h in culture stained for eYFP, Pax7, and MyoD. (C) Percentage of Pax7+ and myogenin+ cells from Mx1-Cre;R26-lsl-tdT mice after 4 days in culture (2,000 cells total; n = 3 mice; left) and representative image (right). (D) Embryonic Dox labeling (E10–E16), chase, and pIpC injection in Mx1-Cre;R26-lsl-tdT mice crossed with TetO-H2B-GFP. (E) FACS plots from Mx1-Cre;R26-lsl-tdT.TetO-H2B-GFP mice. Percentage of LRCs and nLRCs is shown. (F) FACS plots (left) and percentage of Mx1+ LRC/nLRC (right) from Mx1-Cre;R26-lsl-tdT.TetO-H2B-GFP mice (n = 4 mice). (G) Percentage of LRCs within Mx1+ and Mx1SCs (n = 4 mice). (H) Schematic of donor Mx1+ and Mx1 LRC/nLRC derived from embryonically Dox-labeled, chased, and pIpC-treated Mx1-Cre;R26-lsl-tdT.TetO-H2B-GFP mice, transplanted into WT host exposed to whole-body IR, WT-BMT, and BaCl2-muscle injured. Dox water was given to the host during regeneration. (I) Number of Mx1+ and Mx1LRC/nLRC donor-derived nuclei per muscle. Red dashed line represents number of transplanted cells (left). Images of transplanted muscle from Mx1+ and Mx1 LRCs (right; n = 3 mice) are shown. Data are presented as mean ± SEM in (A), (F), (G), and (I), and as SD in (C); ****p < 0.0001, ***p < 0.001, *p < 0.05. Scale bars, 20 μm in (A)–(C) and 500 μm (E). DAPI was used for nuclear staining. See also Figure S1.
Figure 2.
Figure 2.. Mx1-Cre+ SCs Retain Stem Cell Potential after Irradiation
(A) Imaging site of TA muscle (dashed square) that is ~1 mm apart from tibial head (solid square) is shown (left). Bone collagen (blue) and vasculature-using quantum-dot labeling (red) are shown. (B) Schematic of transplantation and sequential imaging of FACS sorted DS-Red and Mx1+ SCs from ±IR Actb-DS-Red and ±IR Mx1-Cre;R26-lsl-eYFP donor mice into WT mice exposed to 9 Gy whole-body IR, WT-BMT, and BaCl2 muscle injury (C) Sequential images of pre-IR and BaCl2-injured muscles transplanted with 3,000 Mx1+ SCs (green) or DS-Red SCs (red) from ±IR donor mice at 7, 14, and 30 days after engraftment. Collagen fibrils are in blue. High magnification of engrafted cells is in top left corner. (D) Mean fiber fluorescence pixel intensity (a.u.) from z stack reconstructions in recipient mice transplanted with DS-Red SCs and Mx1+ SCs. (E) In vivo imaging of injured muscles 30 days after engraftment of 3,000 Mx1+Sca1+ FAPs. Top right corner shows interstitial Mx1+Sca1+ cells outside the muscle fibers in the perivascular space (quantum-dot labeling; red). Data are presented as mean ± SD; *p < 0.05. Scale bars, 100 μm. DAPI was used for nuclear staining. See also Figure S2.
Figure 3.
Figure 3.. Mx1-Cre+ SCs Are Radiotolerant
(A) Scheme of pIpC injection for Mx1-Cre;R26-lsl-eYFP mice, IR, WT-BMT, FACS, and muscle fiber harvesting (top). Number of Mx1+ and Mx1Pax7+ SCs/fiber from ±IR Mx1-Cre;R26-lsl-eYFP mice (n = 4–6 mice; bottom). (B) Schematic of pIpC injection of Mx1-Cre;R26-lsl-eYFP, FACS, and in vitro IR of SCs (top). +IR Mx1 and Mx1+ SCs stained for YFP, Pax7, and γH2AX (left) are shown. Number of γH2AX+ foci per Pax7+ nuclei 10 min after in vitro IR exposure is shown (2 Gy; 130 → 174 cells total; n = 3 mice; middle). Olive tail moment 10 min after 2 Gy IR is shown (150 → 300 cells per condition, n = 3; right). (C) Time course of γH2AX+ foci per Pax7+ nuclei after IR (100 → 225 cells each time point; n = 3 mice). (D) Binned ranges of γH2AX+ foci per nuclei in FACS sorted LRC and nLRC 10 min after in vitro IR (2 Gy). (E) Mean cell ROX fluorescence intensity (a.u.) 60 min after 2 Gy IR (50 → 188 cells; n = 3). Data are presented as mean ± SEM in (A)–(C) and (E), and as SD in (D); **p < 0.01; ***p < 0.001; ****p < 0.0001. Scale bar, 5 μm. DAPI was used for nuclear staining. See also Figure S3.
Figure 4.
Figure 4.. Mx1-Cre+ SCs Function as Reserve Muscle Stem Cells
(A) Scheme of pIpC administration of Mx1-Cre;R26-lsl-eYFP mice, prior to IR, WT-BMT, and multiple rounds of muscle injury. (B) Muscle sections from uninjured and injured muscles ±pIpC and ±IR. Muscle sections stained for eYFP and laminin. Inset in +IR 1st injury is described in (C). (C) High magnification of regenerating muscle (from inset in B) after 1st injury and IR. White arrowhead shows a rare YFP regenerated muscle fiber, surrounded by YFP+ regenerating muscle fibers. Non-regenerating fibers have undetectable levels of YFP (white arrow). (D) Percentage of YFP+ fibers in uninjured, primary, and secondary injured muscle in ±IR conditions. (E) Central-nucleated Mx1+ muscle fiber (arrowhead) and Mx1+ SCs (white arrow) under the basal lamina 30 days after primary injury, detected by anti-GFP, anti-laminin, and anti-Pax7 staining (left). Number of SCs/muscle section (n = 3 mice) from uninjured and 1st injury from ±IR (right) is shown. Data are presented as mean ± SEM in (D), and as SD in (E); **p < 0.01; ***p < 0.001. Scale bars, 50 μm in (B), 100 μm in (C), and 10 μm in (E). DAPI was used for nuclear staining. See also Figure S4.
Figure 5.
Figure 5.. Pax3 Is Enriched in Mx1-Cre+ SCs
(A) Transcript levels of Pax7, Myf5, and Pax3 in freshly isolated Mx1+ and Mx1 SCs (n = 3). (B) Confocal images of RNA FISH for Pax3 (red) combined with immunohistochemical detection of eYFP (green) and Pax7 (yellow; left). Number of Pax3 mRNA foci in Mx1+/Mx1 SCs (100 → 130 cells; n = 2; middle) and LRC/nLRCs (518 → 517 cells; n = 2; left) is shown. (C) Percentage of Pax3+ mRNA foci in Mx1+/Mx1 SCs (top) and LRC/nLRCs (bottom) from (B). (D) Confocal images of Pax3 and Pax3+ SCs from Pax3GFP/+ mice stained for GFP, Pax7, and γH2AX (left). Number of γH2AX+ foci per Pax7+ nuclei 10 min after in vitro +IR (2 Gy; n = 4 mice; right) is shown. (E) Mean cell ROX fluorescence intensity (a.u.) before and 60 min after 2 Gy IR (103 → 256 cells; n = 3). (F) Model of radiotolerance based on γH2AX DNA damage analysis across SC populations. Radiotolerance operates as a continuum with Mx1+, Pax3+, and LRC at one end and nLRC at the other end of the damage distribution. (G) Olive tail moment from Pax3CE/+-tdT+ and Pax3CE/f-tdT+ SCs in −IR and +IR (10 min after 2 Gy IR; 269 → 374 cells; n = 3). (H) Mean cell ROX fluorescence intensity (a.u.) of FACS sorted Pax3CE/+-YFP+ and Pax3CE/f-YFP+ SCs in −IR and +IR (60 min after 2 Gy IR; 100 → 267 cells; n = 3). (I) Percentage of caspase 3+ SCs 48 h after +IR in vitro (n = 3). Data are presented as mean ± SEM in (B), (D), (E), and (G)–(I), and as SD in (A); ****p < 0.0001; ***p < 0.001; **p < 0.01; *p < 0.05. Scale bars, 5 μm. DAPI was used for nuclear staining. See also Figure S5.
Figure 6.
Figure 6.. Inhibition of ROS Promotes Tolerance and Survival in Radiosensitive SCs
(A) Schematic of Pax3CE/+-tdT+ and Pax3CE/+-tdT SCs treated with or without NAC up to 24 h post-IR (top) and number of γH2AX+ foci per Pax7+nuclei at 10 min, 2 h, and 24 h post-IR (n = 2; bottom). (B) Schematic of Pax3CE/+-tdT+, Pax3CE/+-tdT, and Pax3CE/f-tdT+ SCs treated with or without NAC up to 24 h post-IR (top). Number of γH2AX+ foci per Pax7+ nuclei at 2 h and 24 h post-IR and percentage of caspase3+ SCs after 24 h in culture (n = 2) is shown. (C) Schematic of Pax3CE/+-tdT+, Pax3CE/+-tdT, and Pax3CE/f-tdT+ SCs treated with or without NAC up to 2 h post-IR (top). Number of γH2AX+ foci per Pax7+ nuclei and percentage of caspase3+ SCs after 24 h in culture with or without NAC (n = 2) is shown. Data are presented as mean ± SEM; ****p <0.0001; ***p < 0.001; **p < 0.01; *p < 0.05; n.s., not significant. See also Figure S6.
Figure 7.
Figure 7.. Pax3 Is Required for RSC Clonal Expansion after Transplantation
(A) Schematic of 3,000 Pax3+ SCs from ±IR Pax3CE/+-tdT+ and Pax3CE/f-tdT+ donor mice transplanted into locally IR (24 Gy) and BaCl2-injured muscle of WT recipient mice. (B) Image of muscle cross-section from transplanted ±IR Pax3CE/+-tdT+ and Pax3CE/f-tdT+ SCs (from A). Muscle stained with anti-laminin (green) is shown. (C) Number of tdT+ donor-derived fibers/muscle section from transplanted ±IR Pax3CE/+-tdT+ and Pax3CE/f-tdT+ SCs (from A; n = 13 → 20 sections across 1 mm of TA muscle; n = 3 mice). (D) Model of radiotolerant Mx1-Cre+/Pax3+/Pax7+ RSCs capable of clonal expansion during tissue regeneration upon radiation stress. Data are presented as mean ± SEM; ****p < 0.0001. Scale bar, 100 μm. DAPI was used for nuclear staining.

Similar articles

Cited by

References

    1. Bigarella CL, Liang R, and Ghaffari S (2014). Stem cells and the impact of ROS signaling. Development 141, 4206–4218. - PMC - PubMed
    1. Blanpain C, Mohrin M, Sotiropoulou PA, and Passegué E (2011). DNA-damage response in tissue-specific and cancer stem cells. Cell Stem Cell 8, 16–29. - PubMed
    1. Boutet SC, Biressi S, Iori K, Natu V, and Rando TA (2010). Taf1 regulates Pax3 protein by monoubiquitination in skeletal muscle progenitors. Mol. Cell 40, 749–761. - PMC - PubMed
    1. Brooks MD, Burness ML, and Wicha MS (2015). Therapeutic implications of cellular heterogeneity and plasticity in breast cancer. Cell Stem Cell 17, 260–271. - PMC - PubMed
    1. Chakkalakal JV, Jones KM, Basson MA, and Brack AS (2012). The aged niche disrupts muscle stem cell quiescence. Nature 490, 355–360. - PMC - PubMed

Publication types