. 2019 Jun 6;24(6):958-973.e9.
doi: 10.1016/j.stem.2019.03.019. Epub 2019 Apr 18.

PAX3 Confers Functional Heterogeneity in Skeletal Muscle Stem Cell Responses to Environmental Stress

Affiliations

PAX3 Confers Functional Heterogeneity in Skeletal Muscle Stem Cell Responses to Environmental Stress

Audrey Der Vartanian et al. Cell Stem Cell. .

Abstract

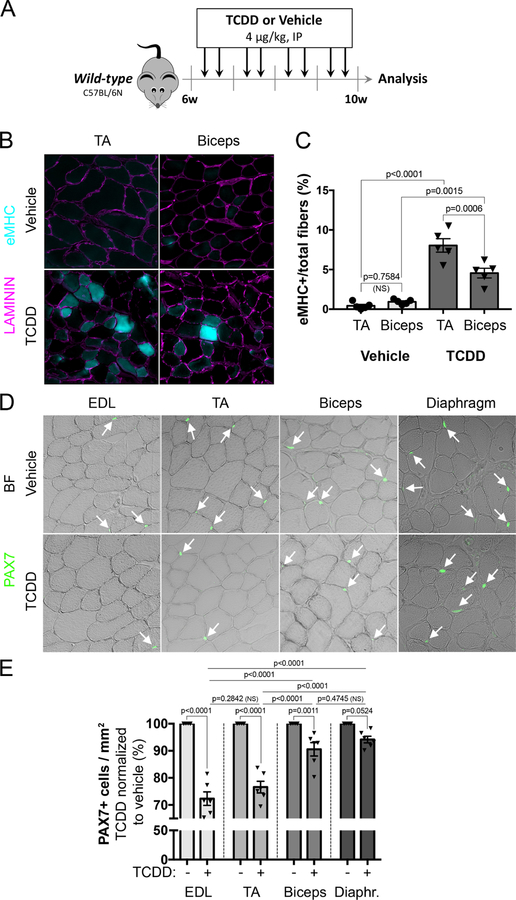
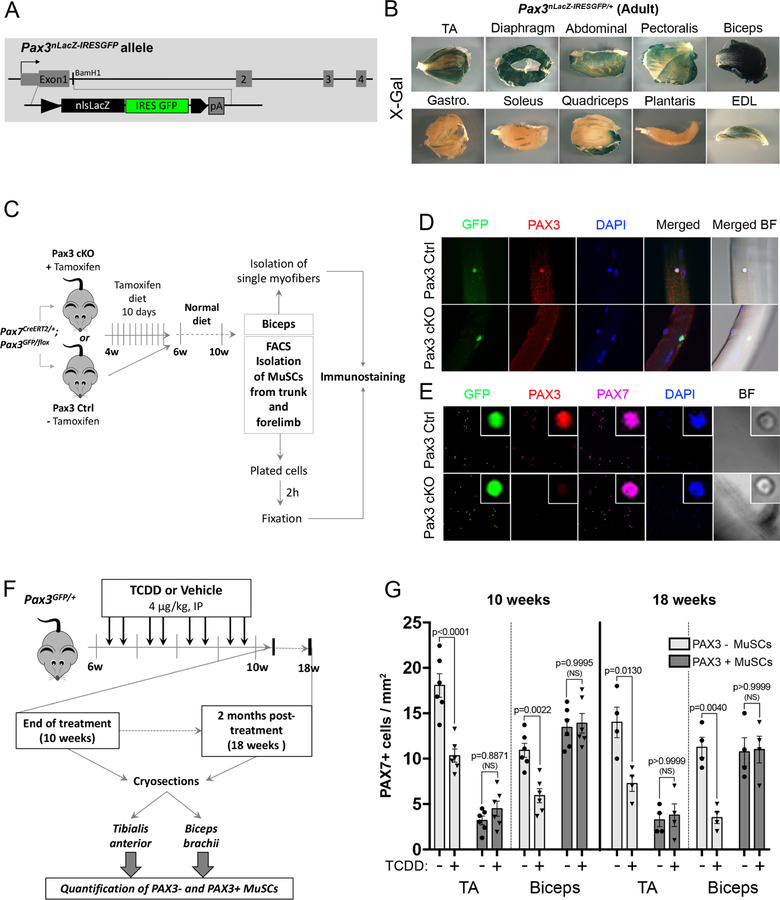
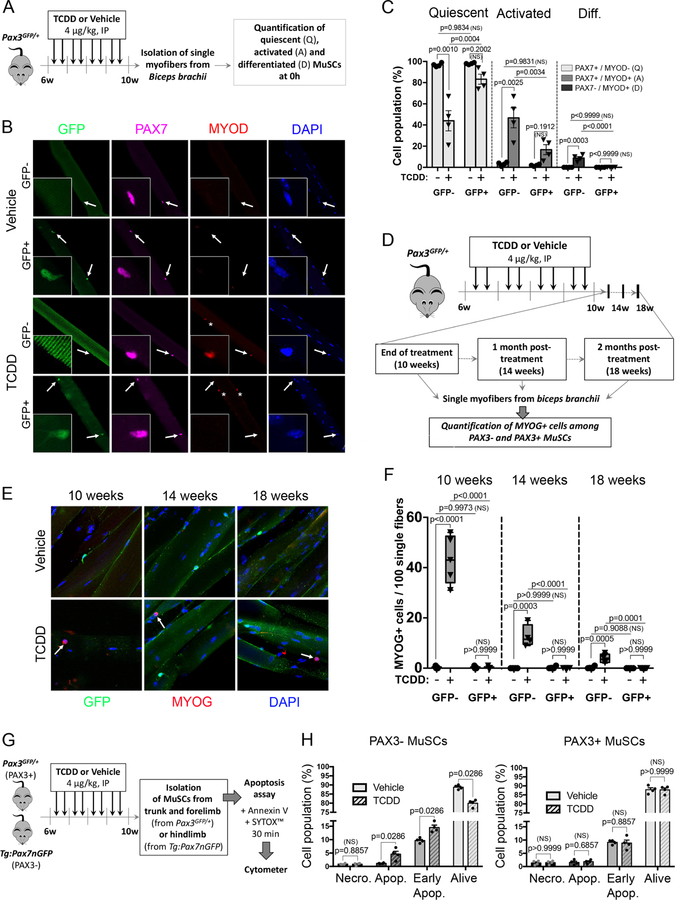
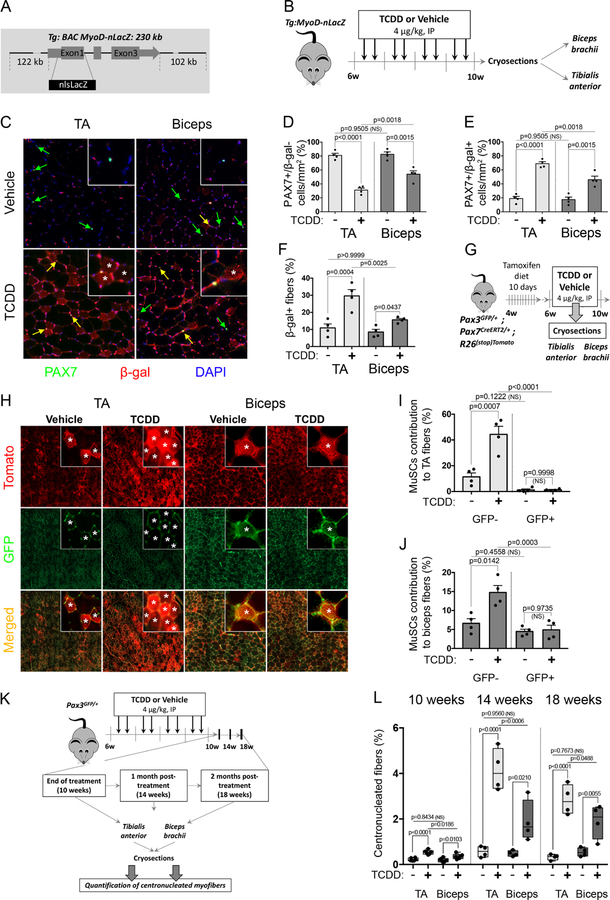
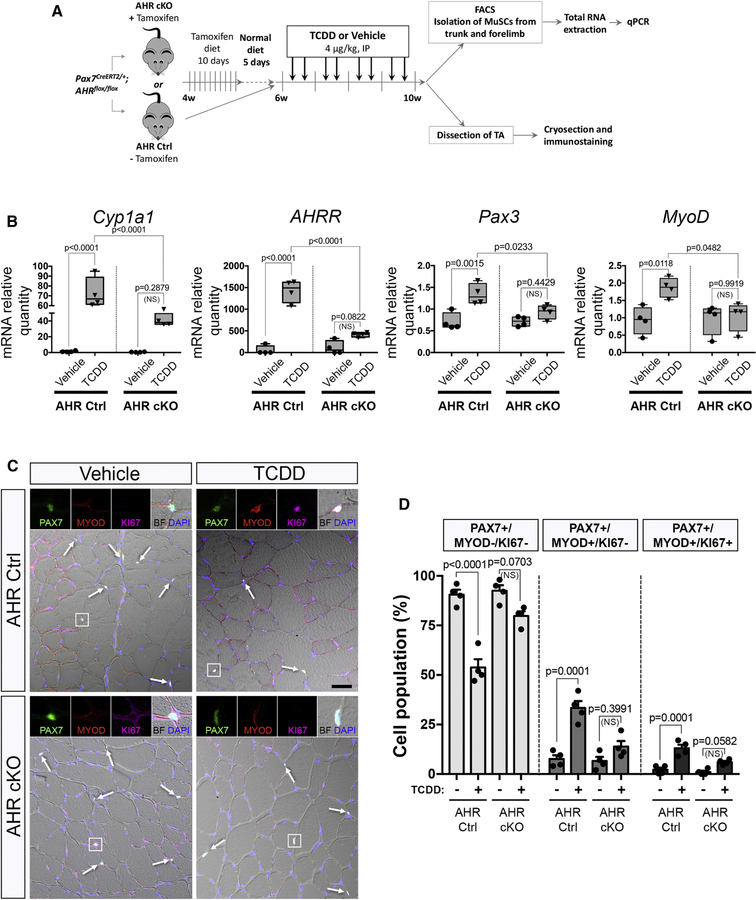
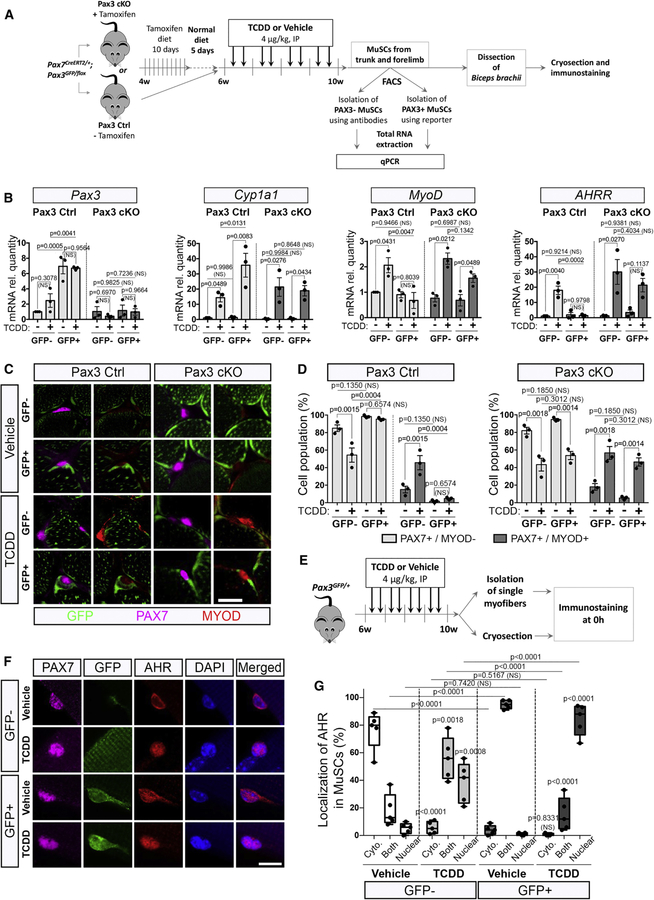
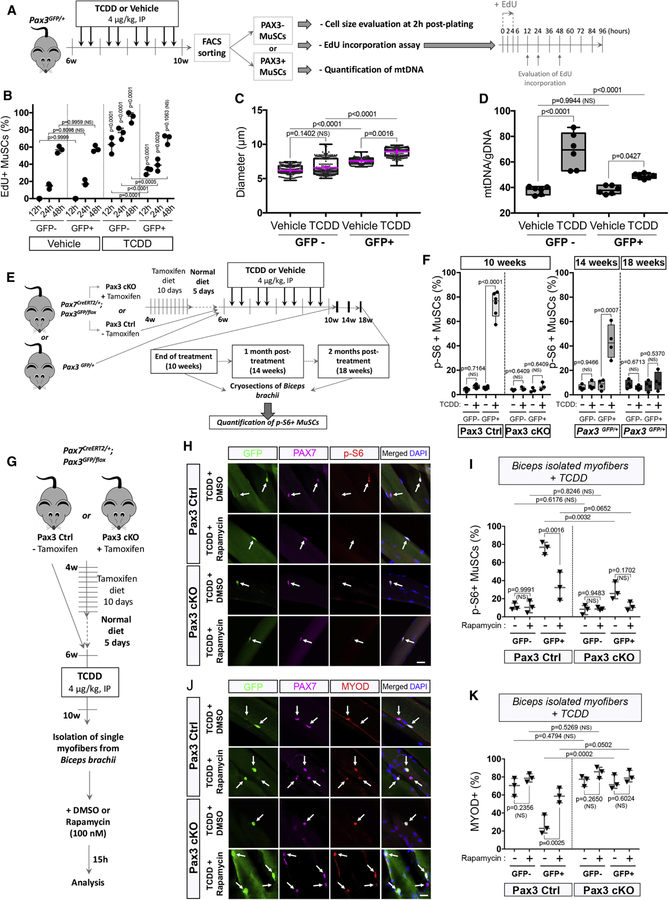
Muscle satellite cells (MuSCs) are the quiescent muscle stem cells required for adult skeletal muscle repair. The impact of environmental stress such as pollution on MuSC behavior remains unexplored. We evaluated the impact of 2,3,7,8-tetrachlorodibenzo-p-dioxin (TCDD) exposure, a ubiquitous and highly toxic pollutant, on MuSCs by combining in vivo mouse molecular genetic models with ex vivo studies. While all MuSCs express the transcription factor PAX7, we show that a subset also express PAX3 and exhibit resistance to environmental stress. Upon systemic TCDD treatment, PAX3-negative MuSCs display impaired survival, atypical activation, and sporadic differentiation through xenobiotic aryl hydrocarbon receptor signaling. We further show that PAX3-positive MuSCs become sensitized to environmental stress when PAX3 function is impaired and that PAX3-mediated induction of mTORC1 is required for protection. Our study, therefore, identifies a functional heterogeneity of MuSCs in response to environmental stress controlled by PAX3.

Keywords: AHR; G(alert); PAX3; TCDD; environmental stress; muscle stem cells; satellite cells; skeletal muscle.


Conflict of interest statement

DECLARATION OF INTERESTS

The authors declare no competing interests.

Figures

Figure 1
Figure 1. Exposure to TCDD pollutant affects skeletal muscle homeostasis and MuSC number.
(A) Experimental design. (B) Representative pictures of double immunofluorescence staining of LAMININ (purple) and embryonic Myosin Heavy Chain (eMHC, blue) on Tibialis Anterior (TA) or Biceps brachii (Biceps) muscle sections from mice treated with vehicle (nonane, top panel) or TCDD (4µg/kg, bottom panel). Scale bar, 40 µm. (C) Quantification of eMHC positive myofibers performed on Tibialis Anterior (TA) or Biceps brachii (Biceps) muscle sections from mice treated with vehicle (nonane) or TCDD (4µg/kg). Means ± SEM (n=5), two-way ANOVA. P values calculated by Sidak’s post-test. NS, not significant. (D) Representative pictures of immunofluorescence staining of PAX7+ cells performed on Extensor digitorum longus (EDL), Tibialis Anterior (TA), Biceps brachii (Biceps) and diaphragm muscle sections from mice receiving vehicle (nonane) or TCDD (4µg/kg). Scale bar, 20 µm. BF, brightfield. (E) Quantification of PAX7+ cells per surface area (mm2) performed on Extensor digitorum longus (EDL), Tibialis Anterior (TA), Biceps brachii (Biceps) and diaphragm muscle sections from mice receiving TCDD (4µg/kg) normalized to vehicle (nonane) condition in percentage. Means ± SEM (n=5), two-way ANOVA. P values calculated by Sidak’s post-test. NS, not significant.
Figure 2
Figure 2. Differential loss of MuSCs exposed to TCDD is linked to muscle-specific expression of PAX3.
(A) Construction of Pax3nLacZ-IRESGFP/+ mice: a nls-LacZ IRES-GFP cassette was inserted into the translation start site in exon 1 of the Pax3 gene to follow PAX3 spatiotemporal expression (see Material & methods for details). (B) Representative picture of X-gal staining performed on different adult whole skeletal muscles from Pax3nLacZ-IRESGFP/+ adult (2 months) mice showing that PAX3-derived MuSCs subpopulation is differentially distributed within adult skeletal muscles. Scale bar, 1mm. TA: Tibialis Anterior, Gastro.: Gastrocnemius EDL: Extensor Digitorum Longus. (C) Experimental design. (D) Representative co-immunofluorescence staining of GFP (PAX3 reporter, green), PAX3 (red), and nuclei (DAPI, blue) performed on single myofibers. Scale bar 40µm. BF, brightfield. (E) Representative co-immunofluorescence staining of GFP (PAX3 reporter, green), PAX3 (red), PAX7 (pink) and nuclei (DAPI, blue) performed on isolated MuSCs. Scale bar, 40µm (overview) or 5 µm (inset). (F) Experimental design. (G) Quantification of PAX7+ cells per surface area (mm2) performed on Tibialis Anterior (TA) and Biceps brachii (Biceps) muscle sections from mice receiving TCDD (4µg/kg) or vehicle (nonane) and analyzed at the end of 4 weeks-treatment period (10 weeks) or 2 months (18 weeks) post-treatment. Means ± SEM (n=4–6), two-way ANOVA. P values calculated by Sidak’s post-test. NS, not significant.
Figure 3
Figure 3. Bimodal response of MuSCs to TCDD correlates with PAX3 expression
(A) Experimental design. (B) Representative co-immunofluorescence staining of single myofibers from biceps isolated from mice receiving vehicle (nonane, top) or TCDD (4µg/kg, bottom), using antibodies against GFP (PAX3 reporter, green), PAX7 (pink), MYOD (red) and nuclei (DAPI, blue). White arrows indicate MuSCs and asterisks highlight PAX7-/MYOD+ MuSCs peculiar population. Scale bar, 40 µm. (C) Quantification of (B) showing quiescent (PAX7+/MYOD-), activated (PAX7+/MYOD+) and differentiated (PAX7-/MYOD+) MuSCs within PAX3-negative (GFP-) and PAX3-positive (GFP+) MuSCs on single myofibers from biceps isolated from mice receiving vehicle (nonane) or TCDD (4µg/kg). Means ± SEM (n=4), two-way ANOVA. P values calculated by Sidak’s post-test. NS, not significant. (D) Experimental design. (E) Representative co-immunofluorescence staining of single myofibers from biceps isolated from mice receiving vehicle (nonane, top) or TCDD (4µg/kg, bottom), using antibodies against GFP (PAX3 reporter, green), MYOG (red) and nuclei (DAPI, blue) at the end of the treatment (10 weeks), 1 month (14 weeks) or 2 months (18 weeks) post-treatment. White arrows indicate MYOG+ MuSC population. Scale bar, 10 µm. (F) Quantification of (E) showing MYOG+ cells within PAX3-negative (GFP-) and PAX3-positive (GFP+) cells on single myofibers from biceps isolated from mice receiving vehicle (nonane) or TCDD (4µg/kg) at the end of the 4 week- treatment period (10 weeks), 1 month (14 weeks) or 2 months (18 weeks) post-treatment. Means ± SEM (n=4), two-way ANOVA. P values calculated by Sidak’s post-test. NS, not significant. (G) Experimental design. (H) Quantification of living cells (Annexin V-; Sytox-), early apoptotic (Annexin V+; Sytox-), apoptotic (Annexin V+; Sytox+) and necrotic cells (Annexin V-; Sytox+) in PAX3- MuSCs (isolated from Tg:Pax7nGFP hindlimb muscles, left) or PAX3+ (isolated from Pax3GFP/+ trunk and forelimb muscles, right). Means ± SEM (n=4), Mann Whitney test. NS, not significant.
Figure 4
Figure 4. TCDD induces fusion of PAX3- MuSCs to myofibers without local injury.
(A) Schematic representation of Tg:MyoD-nlacZ reporter mice. (B) Experimental design. (C) Representative co-immunofluorescence staining of PAX7 (green), ß-galactosidase (MYOD reporter, red) and nuclei (DAPI, blue) from TA or biceps upon vehicle (nonane) or TCDD (4µg/kg) treatment. Quiescent PAX7+/β-galactosidase- cells are shown with green arrows. PAX7+/β-galactosidase+ (activated or derived from activated) cells are shown with yellow arrows. Positive myofibers are labelled with an asterisk. Scale bar, 100µm. (D-F) Quantifications of PAX7+/β-galactosidase- cells (D), PAX7+/β-galactosidase+ cells (E) or ß-galactosidase + myofibers derived from activated MYOD+ MuSCs (F) from TA or biceps upon vehicle (nonane) or TCDD (4µg/kg) treatment as shown in (C). Means ± SEM (n=4), two-way ANOVA. P values calculated by Sidak’s post-test. NS, not significant. (G) Experimental design. (H) Representative co-immunofluorescence staining of GFP (PAX3 reporter, green) and tomato (PAX7 reporter, red) on TA or biceps muscle cryosections after vehicle (nonane) or TCDD (4µg/kg) treatment. Positive myofibers for at least one channel are labelled with an asterisk. Scale bars, 600 µm (TA overview), 200 µm (Biceps overview), 30 µm (insets). (I-J) Quantification of myofibers derived from PAX7+/PAX3- (GFP-) MuSCs (tomato labelled myofibers, red) and from PAX7+/PAX3+ (PAX3+) MuSCs (tomato and GFP labelled myofibers, red and green) from TA (I) or biceps (J) muscle cryosections after vehicle (nonane) or TCDD (4µg/kg) treatment as indicated and shown in (H). Means ± SEM (n=4), two-way ANOVA. P values calculated by Sidak’s post-test. NS, not significant. (K) Experimental design. (L) Quantification of the percentage of centronucleated fibers in biceps brachii (biceps) and tibialis anterior (TA) cryosections performed at the end of the 4 week-treatment period (10 weeks), 1 month (14 weeks) or 2 months (18 weeks) post-treatment. Means ± SEM (n=4–6) two-way ANOVA. P values calculated by Sidak’s post-test. NS, not significant.
Figure 5
Figure 5. AHR signaling is required for MuSC activation in response to TCDD.
(A) Experimental design. (B) Box plot showing the relative expression of AHR target genes (Cyp1a1 and AHRR) and myogenic genes (Pax3 and MyoD) normalized to Tbp and Hprt1 in MuSCs isolated from AHR Ctrl (left panel) and AHR cKO (right panel) mice treated with vehicle (nonane) or TCDD (4µg/kg). Means ± SEM (n=4), two-way ANOVA. P values calculated by Sidak’s post-test. NS, not significant. (C) Representative co-immunofluorescence staining of Tibialis anterior (TA) isolated from AHR Ctrl and AHR cKO mice receiving vehicle (nonane, left) or TCDD (4µg/kg, right), using antibodies against, PAX7 (green), MYOD (red), KI67 (pink) and nuclei staining (DAPI, blue). Arrows show PAX7+ MuSCs. Scale bar, 40 µm. BF, brightfield. (D) Quantification of quiescent (PAX7+/MYOD-/KI67-), activated (PAX7+/MYOD+/KI67-) and cycling (PAX7-/MYOD+/KI67+) MuSCs performed on TA muscle sections from the experiments shown in (C) in AHR Ctrl and AHR cKO mice treated with vehicle or TCDD (4µg/kg). Means ± SEM (n=4), two-way ANOVA. P values calculated by Sidak’s post-test. NS, not significant.
Figure 6
Figure 6. Impairing PAX3 expression leads to MuSC sensitization to TCDD.
(A) Experimental design. (B) MuSCs were isolated from Pax3 Ctrl or Pax3 cKO trunk and forelimb muscles by antibody-based flow cytometry combined with GFP reporter to distinguish PAX3+ (GFP+) from PAX3-(GFP-) MuSCs, from mice treated by vehicle (nonane) or TCDD (4µg/kg). Total RNA was extracted and gene expression study was performed by quantitative Polymerase Chain Reaction (qPCR). Relative expression to Tbp and Hprt1 of target genes is shown in MuSCs from GFP- (PAX3-) or GFP+ (PAX3+) MuSCs. Means ± SEM (n=3), two-way ANOVA. P values calculated by Sidak’s post-test. NS, not significant. (C) Representative co-immunostaining of GFP (PAX3 reporter, green), PAX7 (pink) and MYOD (red) from biceps of Pax3 Ctrl and Pax3 cKO mice treated with vehicle or TCDD (4µg/kg). Scale bar, 20 µm. (D) Quantification of quiescent (PAX7+/MYOD-) and activated (PAX7+/MYOD+) MuSCs from GFP- (PAX3-) or GFP+ (PAX3+) MuSCs in Pax3 Ctrl or Pax3 cKO mice, following treatment with vehicle (TCDD-) or TCDD (4µg/kg, TCDD+). Means ± SEM (n=3), two-way ANOVA. P values calculated by Sidak’s post-test. NS, not significant. (E) Experimental design. (F) Representative co-immunofluorescence staining of AHR (red), GFP (PAX3 reporter, green), PAX7 (pink), and nuclei (DAPI, blue) from isolated biceps fibers of Pax3GFP/+ mice receiving vehicle (nonane) or TCDD (4µg/kg) as indicated. Scale bar, 10µm. (G) Quantification of AHR localization observed in (F) within the PAX3-negative (GFP-) and PAX3-positive (GFP+) MuSCs. Means ± SEM (n=5), two-way ANOVA. P values calculated by Sidak’s post-test. NS, not significant.
Figure 7
Figure 7. PAX3 expression controls the adaptive transition of quiescent MuSCs from G(0) to G(alert) through the mTORC1 pathway under environmental stress.
(A) Experimental design. (B) EdU incorporation was quantified 12, 24 and 48h post-plating in GFP- and GFP+ MuSCs from mice treated with vehicle (nonane) or TCDD (4µg/kg). Means ± SEM (n=3), two-way ANOVA. P values calculated by Sidak’s post-test. NS, not significant. (C) Box and wiskers plots showing the diameter (µm) repartition of PAX3- (GFP-) or PAX3+ (GFP+) MuSCs from mice treated with vehicle (nonane) or TCDD (4µg/kg). Means (pink) ± SEM (n=4), two-way ANOVA. P values calculated by Sidak’s post-test. NS, not significant. (D) Quantification of mtDNA/genomic (g) DNA ratio by qRT–PCR in PAX3-negative (GFP-) and PAX3-positive (GFP+) MuSCs from mice treated with vehicle (nonane) or TCDD (4µg/kg). Means ± SEM (n=6), two-way ANOVA. P values calculated by Sidak’s post-test. NS, not significant. (E) Experimental design. (F) Quantification of p-S6 immunofluorescence staining at the end of treatment (10 weeks) in Pax3 Ctrl or Pax3cKO mice and 1 month (14 weeks) or 2 months (18 weeks) post-treatment in Pax3GFP/+ mice. Means ± SEM (n=3–6), two-way ANOVA. P values calculated by Sidak’s post-test. NS, not significant. (G) Experimental design. (H) Representative co-immunofluorescence staining of single myofibers from biceps isolated from TCDD-treated mice and incubated 15h with rapamycin or its vehicle (DMSO), using antibodies against GFP (PAX3 reporter, green), PAX7 (pink), p-S6 (red) and nuclear staining (DAPI, blue). Scale bar, 20 µm. (I) Quantification of (H) showing p-S6+ cells on myofibers isolated from biceps of Pax3 Ctrl and Pax3 cKO mice receiving TCDD (4µg/kg) and incubated 15h with rapamycin or its vehicle. GFP- and GFP+ cells were quantified independently as indicated in either Pax3 ctrl or Pax3 cKO mice. Means ± SEM (n=3), two-way ANOVA. P values calculated by Sidak’s post-test. NS, not significant. (J) Representative co-immunofluorescence staining of single myofibers from biceps isolated from mice receiving TCDD (4µg/kg) and incubated 15h with rapamycin or its vehicle, using antibodies against GFP (PAX3 reporter, green), PAX7 (pink), MYOD (red) and nuclear staining (DAPI, blue). Scale bar, 20 µm. (K) Quantification of (J) showing MYOD+ cells on myofibers isolated from biceps of Pax3 Ctrl and Pax3 cKO mice receiving TCDD (4µg/kg) treatment and incubated 15h with rapamycin or its vehicle. GFP- and GFP+ cells were quantified independently as indicated in either Pax3 ctrl or Pax3 cKO mice. Means ± SEM (n=3), two-way ANOVA. P values calculated by Sidak’s post-test. NS, not significant.

Similar articles

Cited by

References

    1. Alonso-Martin S, Aurade F, Mademtzoglou D, Rochat A, Zammit PS, and Relaix F (2018). SOXF factors regulate murine satellite cell self-renewal and function through inhibition of beta-catenin activity. Elife 7. - PMC - PubMed
    1. Baghdadi MB, Castel D, Machado L, Fukada SI, Birk DE, Relaix F, Tajbakhsh S, and Mourikis P (2018). Reciprocal signalling by Notch-Collagen V-CALCR retains muscle stem cells in their niche. Nature 557, 714–718. - PMC - PubMed
    1. Bentzinger CF, Wang YX, Dumont NA, and Rudnicki MA (2013). Cellular dynamics in the muscle satellite cell niche. EMBO Rep 14, 1062–1072. - PMC - PubMed
    1. Bismuth K, and Relaix F (2010). Genetic regulation of skeletal muscle development. Exp Cell Res 316, 3081–3086. - PubMed
    1. Bjornson CR, Cheung TH, Liu L, Tripathi PV, Steeper KM, and Rando TA (2012). Notch signaling is necessary to maintain quiescence in adult muscle stem cells. Stem Cells 30, 232–242. - PMC - PubMed

Publication types

MeSH terms

Substances