. 2019 Aug 9;65(4):381-388.
doi: 10.1262/jrd.2018-153. Epub 2019 Apr 20.

Increased luminescence of the GloSensor cAMP assay in LβT2 cells does not correlate with cAMP accumulation under low pH conditions

Affiliations

Increased luminescence of the GloSensor cAMP assay in LβT2 cells does not correlate with cAMP accumulation under low pH conditions

Shiori Musha et al. J Reprod Dev. .

Abstract

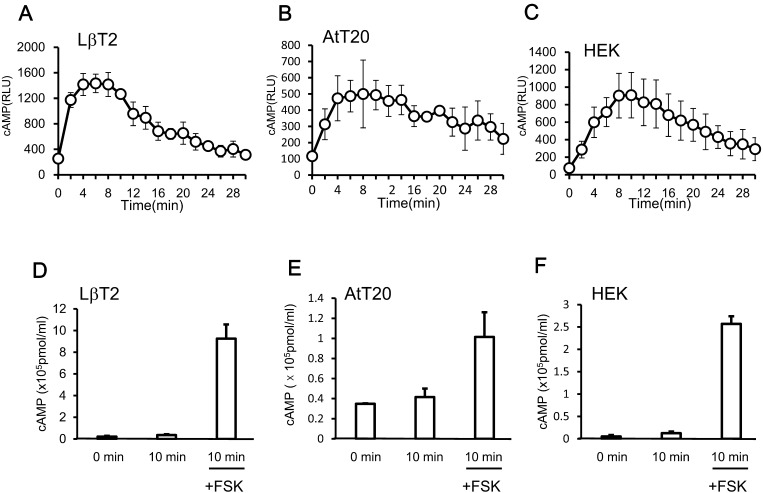
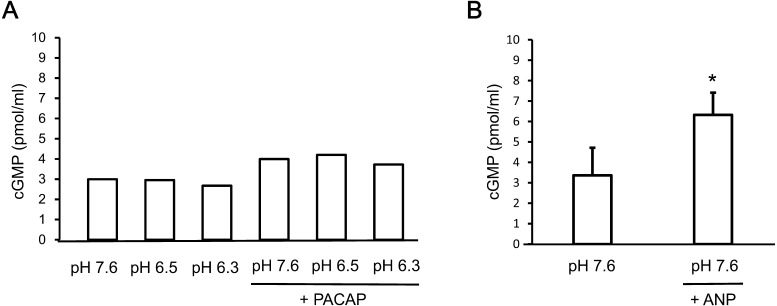
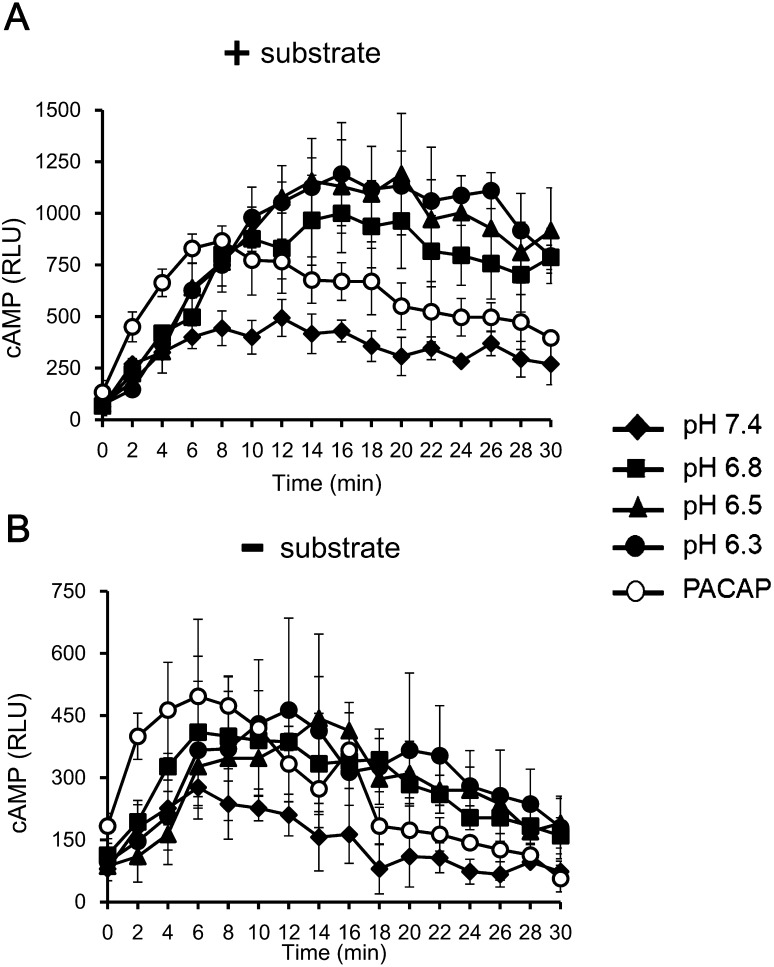
Cyclic adenosine monophosphate (cAMP) plays a pivotal role in gonadotrope responses in the pituitary. Gonadotropin-releasing hormone (GnRH) mediated synthesis and secretion of follicle-stimulating hormone (FSH) and luteinizing hormone (LH) are regulated by both the Gs/cAMP and Gq/Ca2+ signaling pathways. Pituitary adenylate cyclase-activating polypeptide (PACAP) also regulates GnRH responsiveness in gonadotropes through the PACAP receptor, which activates the Gs/cAMP signaling pathway. Therefore, measuring intracellular cAMP levels is important for elucidating the molecular mechanisms of FSH and LH synthesis and secretion in gonadotropes. The GloSensor cAMP assay is useful for detecting cAMP levels in intact, living cells. In this study, we found that increased GloSensor luminescence intensity did not correlate with cAMP accumulation in LβT2 cells under low pH conditions. This result indicates that cell type and condition must be considered when using GloSensor cAMP.

Keywords: Cyclic adenosine monophosphate (cAMP); GloSensor; Low pH; Luminescence; LβT2.


Figures

Fig. 1.
Fig. 1.
Proton-sensing GPCR expression in LβT2 and AtT20 cells. (A) The mRNA expression levels of Ogr1, Gpr4, and TDAG8 were assessed by RT-PCR. (B) qPCR was performed to estimate Gpr4 mRNA levels in mouse anterior pituitary lobe (mALP) and in LβT2 and AtT20 cells. Data were calculated using the comparative CT method to estimate the copy number relative to that of Tbp. Data are expressed as the means ± SE of triplicate measurements.
Fig. 2.
Fig. 2.
Low pH, PACAP, and CRH induced GloSensor cAMP luminescence in LβT2 and AtT20 cells. (A) Time-dependent changes in GloSensor cAMP luminescence intensity in LβT2 cells following stimulation by the indicated pH or 100 nM PACAP dissolved in the culture medium at pH 7.4. (B) Time-dependent changes in GloSensor cAMP luminescence intensity in LβT2 cells following stimulation by the indicated pH in the presence of 100 nM PACAP. (C) Time-dependent changes in GloSensor cAMP luminescence intensity in AtT20 cells following stimulation by the indicated pH or 100 nM CRH (pH 7.4). Data are expressed as the means ± SE of triplicate measurements obtained in a single representative experiment and expressed as relative luminescence units (RLU). Similar data were obtained in more than three separate experiments (A–C).
Fig. 3.
Fig. 3.
Effect of a GPR4 antagonist on the increase of low pH-induced luminescence. (A) Time-dependent changes in the luminescence intensity of the GloSensor cAMP reporter in LβT2 cells following stimulation by the indicated pH or 100 nM PACAP (pH 7.4) in the presence of dimethyl sulfoxide (DMSO). DMSO was used to dissolve the GPR4 antagonist [17]. (B) Time-dependent changes in the luminescence intensity of GloSensor cAMP in LβT2 cells following stimulation by the indicated pH or 100 nM PACAP in the presence of 10 µM GPR4 antagonist. Data are expressed as the means ± SE of triplicate measurements obtained in a single representative experiment and expressed as relative luminescence units (RLU). Similar data were obtained in three separate experiments (A, B). (C) Influence of the GPR4 antagonist on the increase in GloSensor cAMP luminescence induced by low pH. Data are expressed as a percentage obtained by dividing the luminescence value indicating the maximum response under the indicated pH by the maximum luminescence value induced by PACAP measured in the same experiment. The black columns show the values in the presence of the GPR4 antagonist and the white columns show the values in the absence of the antagonist. Data are expressed as the means ± SE of values obtained from three separate experiments, as described in (A) and (B).
Fig. 4.
Fig. 4.
Effect of low pH on cAMP accumulation in LβT2 (A, B) or AtT20 cells (C, D). LβT2 cells were stimulated with the indicated pH in the presence or absence of 100 nM PACAP for 30 min (A) or 15 min (B). AtT20 cells were stimulated with the indicated pH in the presence or absence of 100 nM CRH for 30 min (C) or 15 min (D). The levels of cAMP were measured by ELISA. Data represent the means ± SE of triplicate measurements obtained in a single representative experiment. Similar data were obtained in more than 2 independent experiments (A, C) or in a single representative experiment (B, D).
Fig. 5.
Fig. 5.
Effect of forskolin (FSK) on cAMP accumulation in LβT2 (A, D), AtT20 (B, E), and HEK293T (C, F) cells. FSK-induced cAMP accumulation was measured using GloSensor cAMP (A–C). The cells were stimulated with 10 µM FSK. Data are the means ± SE of triplicate measurements obtained in a single representative experiment. The quantity of cAMP at the beginning (0 min) or after 10 min of incubation either with or without 10 µM FSK was measured by ELISA (D–F). Data are the means ± SE of 3 separate experiments.
Fig. 6.
Fig. 6.
Effect of low pH on cGMP accumulation in LβT2 cells. The cells were stimulated with the indicated pH in the presence or absence of 100 nM PACAP (A) or 1 µM ANP for 30 min. Data are the means of duplicate measurements obtained in a single representative experiment (A) or the means ± SE of triplicate measurements (B). Asterisks (*) indicate that the level of cGMP was significantly different (B). * P < 0.05
Fig. 7.
Fig. 7.
Effect of the GloSensor cAMP substrate on the increase in luminescence at low pH. The low pH-induced increase in luminescence was measured in the presence (A) or absence (B) of the GloSensor cAMP substrate. LβT2 cells were pre-loaded with the substrate during the pre-incubation period. The substrate was then removed in (B), but not in (A), before the luminescence was measured. Data represent the means ± SE of triplicate measurements obtained in a single representative experiment and expressed as relative luminescence units (RLU). Similar data were obtained in two separate experiments (A, B).

Similar articles

References

    1. Zhang F, Zhang L, Qi Y, Xu H. Mitochondrial cAMP signaling. Cell Mol Life Sci 2016; 73: 4577–4590. - PMC - PubMed
    1. King MS, Baertschi AJ. The role of intracellular messengers in adrenocorticotropin secretion in vitro. Experientia 1990; 46: 26–40. - PubMed
    1. Tsutsumi R, Mistry D, Webster NJ. Signaling responses to pulsatile gonadotropin-releasing hormone in LbetaT2 gonadotrope cells. J Biol Chem 2010; 285: 20262–20272. - PMC - PubMed
    1. Halvorson LM. PACAP modulates GnRH signaling in gonadotropes. Mol Cell Endocrinol 2014; 385: 45–55. - PubMed
    1. Ramos-Álvarez I, Mantey SA, Nakamura T, Nuche-Berenguer B, Moreno P, Moody TW, Maderdrut JL, Coy DH, Jensen RT. A structure-function study of PACAP using conformationally restricted analogs: Identification of PAC1 receptor-selective PACAP agonists. Peptides 2015; 66: 26–42. - PMC - PubMed

Publication types

MeSH terms

Substances