

Reproducibility of interictal spike propagation in children with refractory epilepsy
- PMID: 31006860
- PMCID: PMC6488404
- DOI: 10.1111/epi.14720
Reproducibility of interictal spike propagation in children with refractory epilepsy
Abstract
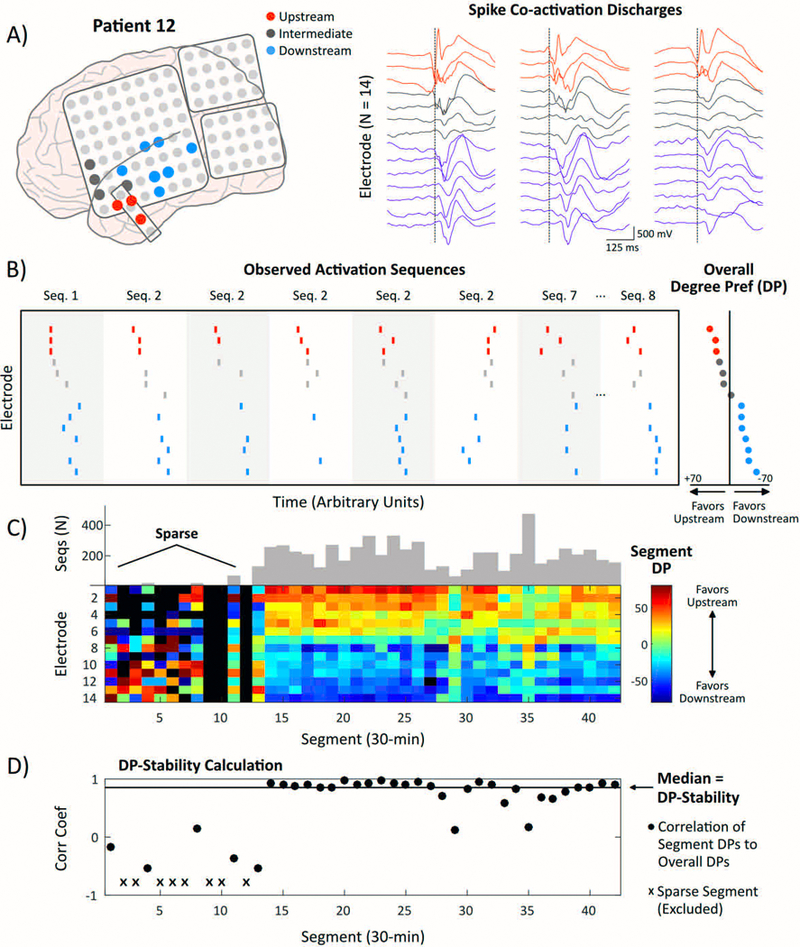
Objective: Interictal spikes are a characteristic feature of invasive electroencephalography (EEG) recordings in children with refractory epilepsy. Spikes frequently co-occur across multiple brain regions with discernable latencies, suggesting that spikes can propagate through distributed neural networks. The purpose of this study was to examine the long-term reproducibility of spike propagation patterns over hours to days of interictal recording.
Methods: Twelve children (mean age 13.1 years) were retrospectively studied. A mean ± standard deviation (SD) of 47.2 ± 40.1 hours of interictal EEG recordings were examined per patient (range 17.5-166.5 hours). Interictal recordings were divided into 30-minute segments. Networks were extracted based on the frequency of spike coactivation between pairs of electrodes. For each 30-minute segment, electrodes were assigned a "Degree Preference (DP)" based on the tendency to appear upstream or downstream within propagation sequences. The consistency of DPs across segments ("DP-Stability") was quantified using the Spearman rank correlation.
Results: Regions exhibited highly stable preferences to appear upstream, intermediate, or downstream in spike propagation sequences. Across networks, the mean ± SD DP-Stability was 0.88 ± 0.07, indicating that propagation patterns observed in 30-minute segments were representative of the patterns observed in the full interictal window. At the group level, regions involved in seizure generation appeared more upstream in spike propagation sequences.
Significance: Interictal spike propagation is a highly reproducible output of epileptic networks. These findings shed new light on the spatiotemporal dynamics that may constrain the network mechanisms of refractory epilepsy.
Keywords: epilepsy surgery; interictal spike; invasive EEG; network; propagation.
Wiley Periodicals, Inc. © 2019 International League Against Epilepsy.
Conflict of interest statement
Competing interests and ethical publication statement
None of the authors has any conflict of interest to disclose.
Figures


Similar articles
-
Spatial distribution of interictal spikes fluctuates over time and localizes seizure onset.Brain. 2020 Feb 1;143(2):554-569. doi: 10.1093/brain/awz386. Brain. 2020. PMID: 31860064 Free PMC article.
-
Highly consistent temporal lobe interictal spike networks revealed from foramen ovale electrodes.Clin Neurophysiol. 2021 Sep;132(9):2065-2074. doi: 10.1016/j.clinph.2021.06.013. Epub 2021 Jul 6. Clin Neurophysiol. 2021. PMID: 34284241 Free PMC article.
-
Quantitative interictal subdural EEG analyses in children with neocortical epilepsy.Epilepsia. 2003 Mar;44(3):425-34. doi: 10.1046/j.1528-1157.2003.38902.x. Epilepsia. 2003. PMID: 12614399
-
Defining epileptogenic networks: Contribution of SEEG and signal analysis.Epilepsia. 2017 Jul;58(7):1131-1147. doi: 10.1111/epi.13791. Epub 2017 May 20. Epilepsia. 2017. PMID: 28543030 Review.
-
Interictal spikes: harbingers or causes of epilepsy?Neurosci Lett. 2011 Jun 27;497(3):247-50. doi: 10.1016/j.neulet.2011.03.070. Epub 2011 Mar 31. Neurosci Lett. 2011. PMID: 21458535 Free PMC article. Review.
Cited by
-
Diffusion tractography predicts propagated high-frequency activity during epileptic spasms.Epilepsia. 2022 Jul;63(7):1787-1798. doi: 10.1111/epi.17251. Epub 2022 Apr 21. Epilepsia. 2022. PMID: 35388455 Free PMC article.
-
Data-driven approach for the delineation of the irritative zone in epilepsy in MEG.PLoS One. 2022 Oct 25;17(10):e0275063. doi: 10.1371/journal.pone.0275063. eCollection 2022. PLoS One. 2022. PMID: 36282803 Free PMC article.
-
Spatial distribution of interictal spikes fluctuates over time and localizes seizure onset.Brain. 2020 Feb 1;143(2):554-569. doi: 10.1093/brain/awz386. Brain. 2020. PMID: 31860064 Free PMC article.
-
Mesial-to-lateral gradients of epileptiform activity to localize mesial temporal lobe epilepsy.Epilepsia. 2025 May 19:10.1111/epi.18462. doi: 10.1111/epi.18462. Online ahead of print. Epilepsia. 2025. PMID: 40387232
-
Co-activation of interictal epileptiform discharges localizes seizure onset zone and fluctuates with brain state.Brain Commun. 2025 Apr 3;7(2):fcaf127. doi: 10.1093/braincomms/fcaf127. eCollection 2025. Brain Commun. 2025. PMID: 40212342 Free PMC article.
References
-
- Badier JM, Chauvel P. Spatio-temporal characteristics of paroxysmal interictal events in human temporal lobe epilepsy. J Physiol Paris 1995; 89: 255–264. - PubMed
-
- Penfield W, Jasper H. Epilepsy and the Functional Anatomy of the Human Brain. J. & A. Churchill: London; 1954.
-
- Baumgartner C, Lindinger G, Ebner A, et al. Propagation of interictal epileptic activity in temporal lobe epilepsy. Neurology 1995; 45: 118–122. - PubMed
-
- Bourien J, Bartolomei F, Bellanger JJ, et al. A method to identify reproducible subsets of co-activated structures during interictal spikes. Application to intracerebral EEG in temporal lobe epilepsy. Clin Neurophysiol 2005; 116: 443–455. - PubMed
Publication types
MeSH terms
Grants and funding
LinkOut - more resources
Full Text Sources
