

Prediction of adverse perinatal outcome by fetal biometry: comparison of customized and population-based standards
- PMID: 31006913
- PMCID: PMC6810752
- DOI: 10.1002/uog.20299
Prediction of adverse perinatal outcome by fetal biometry: comparison of customized and population-based standards
Abstract
Objective: To compare the predictive performance of estimated fetal weight (EFW) percentiles, according to eight growth standards, to detect fetuses at risk for adverse perinatal outcome.
Methods: This was a retrospective cohort study of 3437 African-American women. Population-based (Hadlock, INTERGROWTH-21st , World Health Organization (WHO), Fetal Medicine Foundation (FMF)), ethnicity-specific (Eunice Kennedy Shriver National Institute of Child Health and Human Development (NICHD)), customized (Gestation-Related Optimal Weight (GROW)) and African-American customized (Perinatology Research Branch (PRB)/NICHD) growth standards were used to calculate EFW percentiles from the last available scan prior to delivery. Prediction performance indices and relative risk (RR) were calculated for EFW < 10th and > 90th percentiles, according to each standard, for individual and composite adverse perinatal outcomes. Sensitivity at a fixed (10%) false-positive rate (FPR) and partial (FPR < 10%) and full areas under the receiver-operating-characteristics curves (AUC) were compared between the standards.
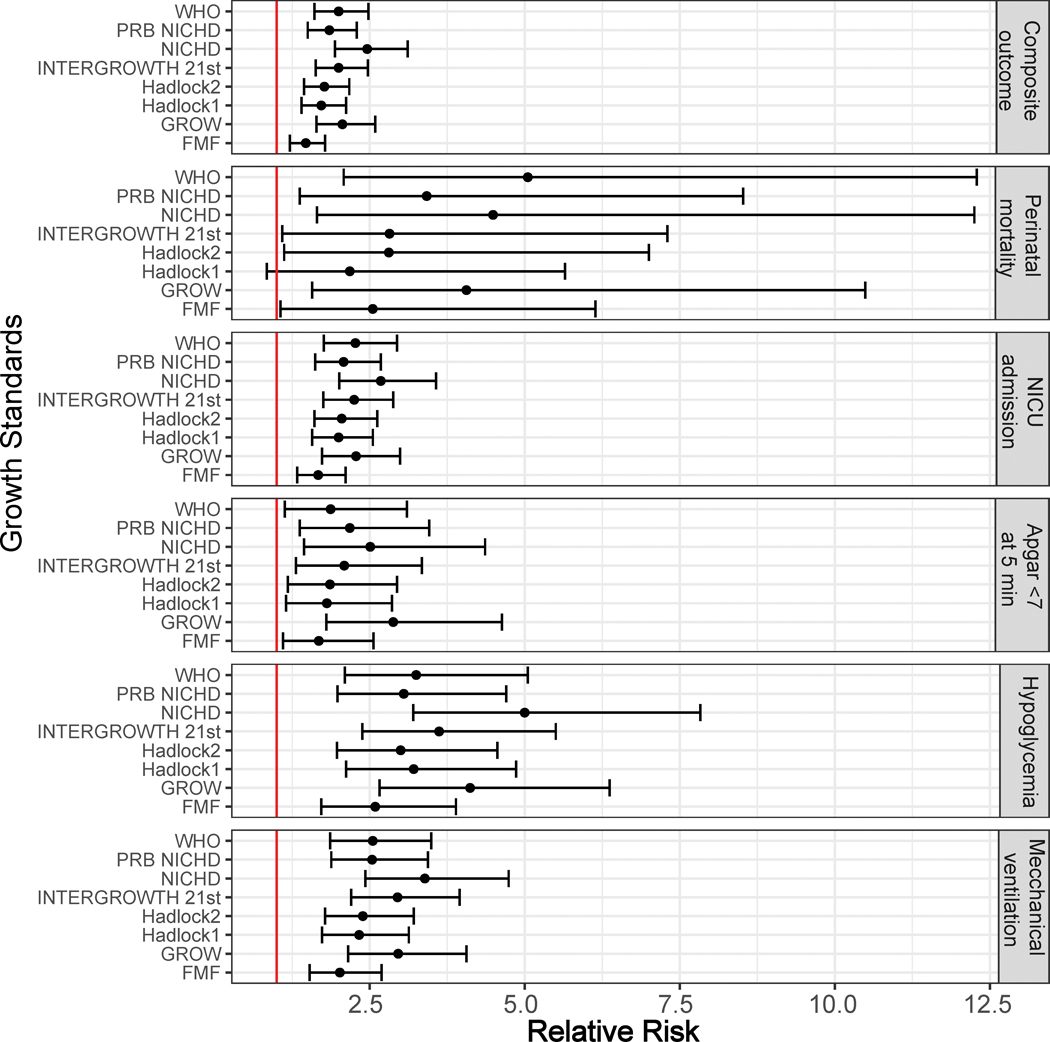
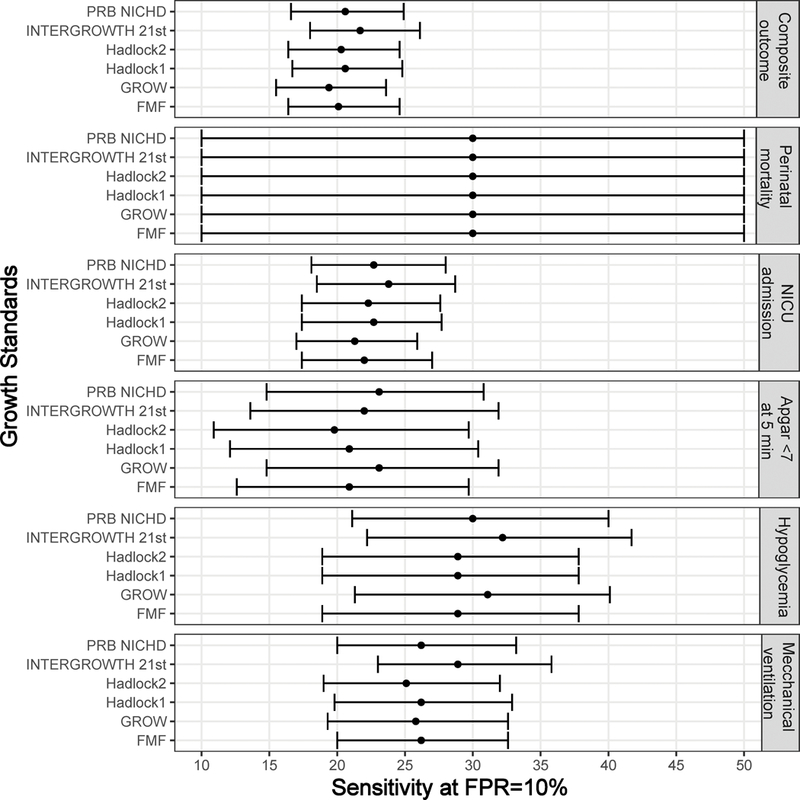
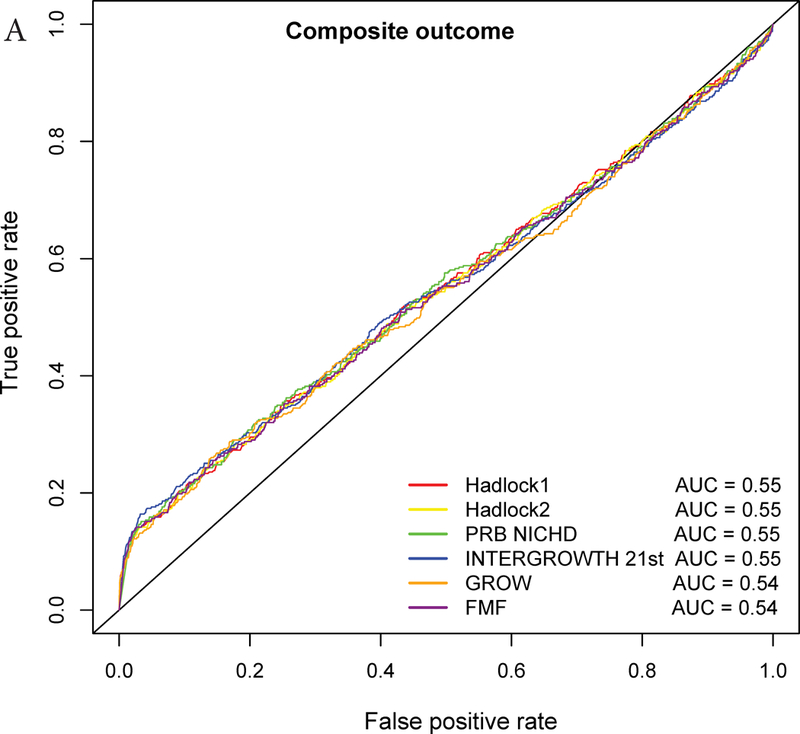
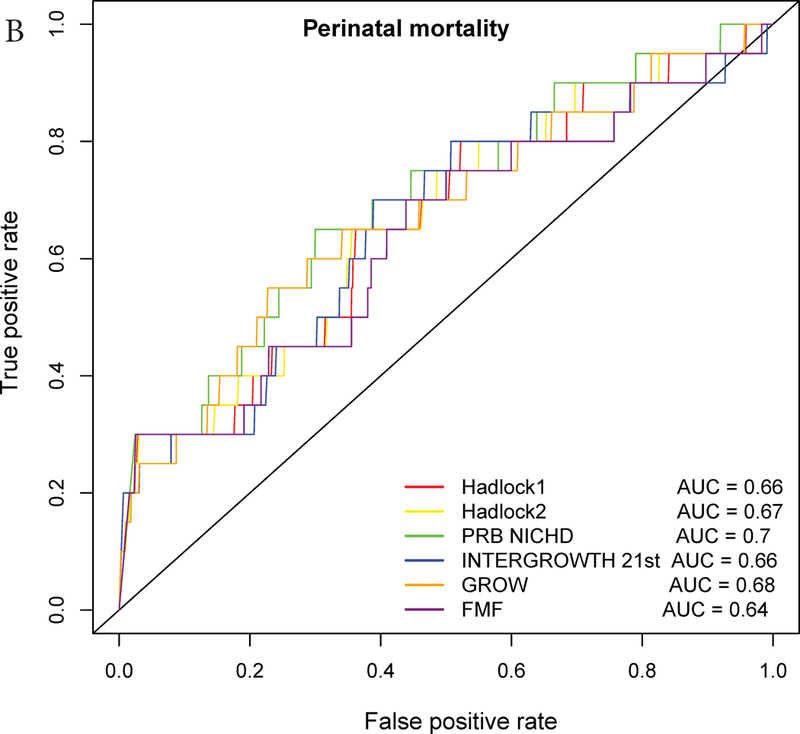
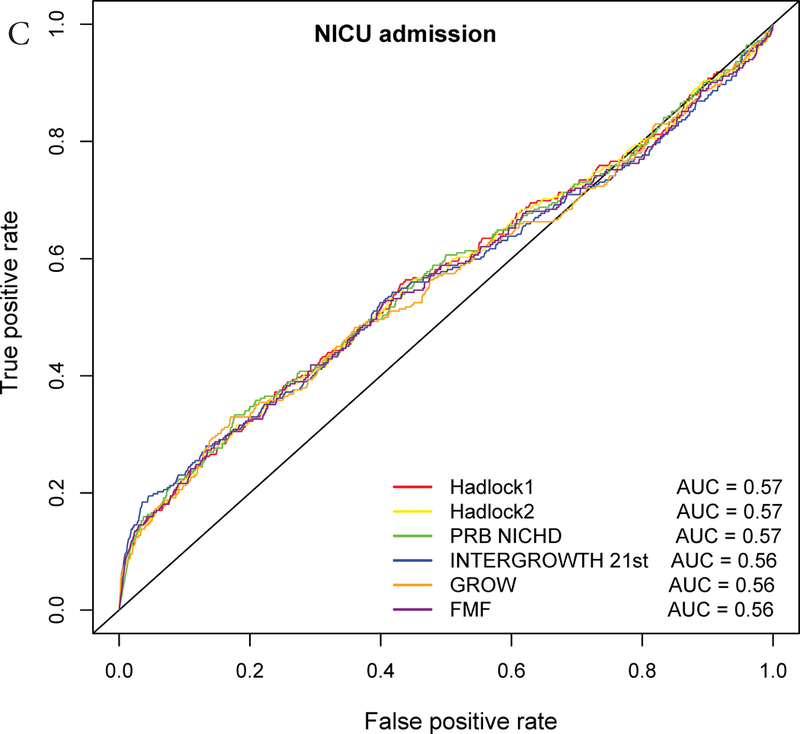
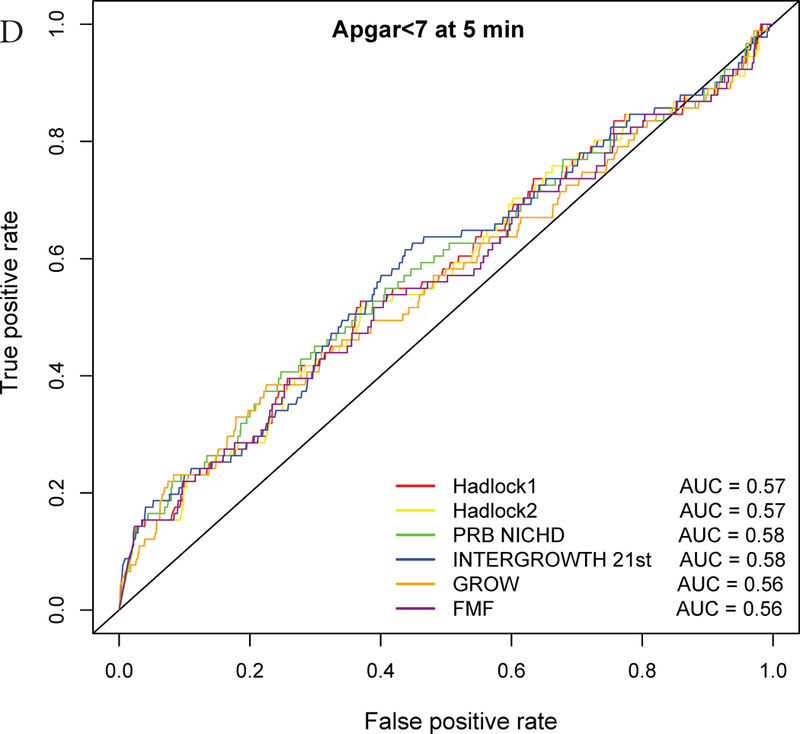
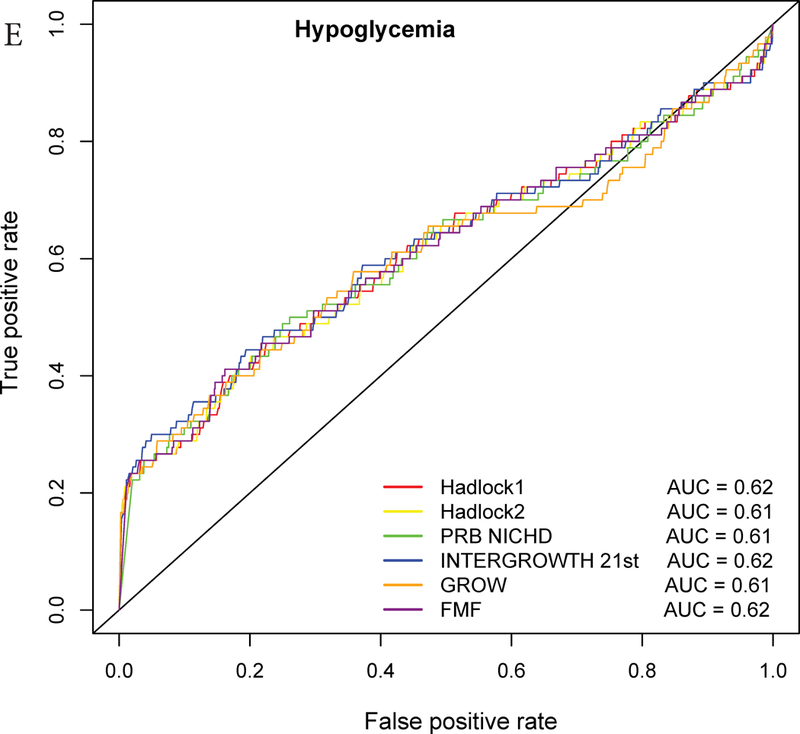
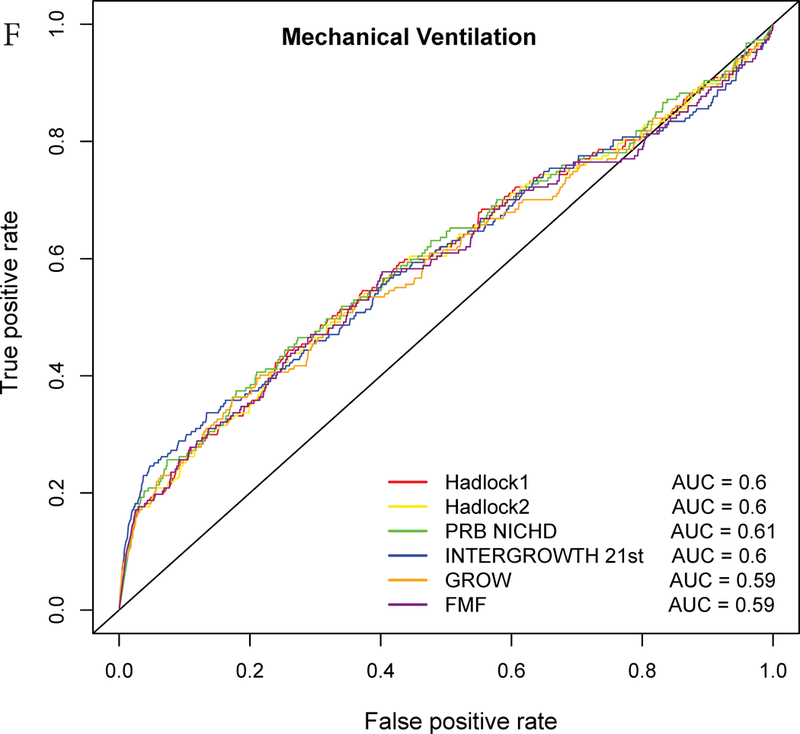
Results: Ten percent (341/3437) of neonates were classified as small-for-gestational age (SGA) at birth, and of these 16.4% (56/341) had at least one adverse perinatal outcome. SGA neonates had a 1.5-fold increased risk of any adverse perinatal outcome (P < 0.05). The screen-positive rate of EFW < 10th percentile varied from 6.8% (NICHD) to 24.4% (FMF). EFW < 10th percentile, according to all standards, was associated with an increased risk for each of the adverse perinatal outcomes considered (P < 0.05 for all). The highest RRs associated with EFW < 10th percentile for each adverse outcome were 5.1 (95% CI, 2.1-12.3) for perinatal mortality (WHO); 5.0 (95% CI, 3.2-7.8) for perinatal hypoglycemia (NICHD); 3.4 (95% CI, 2.4-4.7) for mechanical ventilation (NICHD); 2.9 (95% CI, 1.8-4.6) for 5-min Apgar score < 7 (GROW); 2.7 (95% CI, 2.0-3.6) for neonatal intensive care unit (NICU) admission (NICHD); and 2.5 (95% CI, 1.9-3.1) for composite adverse perinatal outcome (NICHD). Although the RR CIs overlapped among all standards for each individual outcome, the RR of composite adverse perinatal outcome in pregnancies with EFW < 10th percentile was higher according to the NICHD (2.46; 95% CI, 1.9-3.1) than the FMF (1.47; 95% CI, 1.2-1.8) standard. The sensitivity for composite adverse perinatal outcome varied substantially between standards, ranging from 15% for NICHD to 32% for FMF, due mostly to differences in FPR; this variation subsided when the FPR was set to the same value (10%). Analysis of AUC revealed significantly better performance for the prediction of perinatal mortality by the PRB/NICHD standard (AUC = 0.70) compared with the Hadlock (AUC = 0.66) and FMF (AUC = 0.64) standards. Evaluation of partial AUC (FPR < 10%) demonstrated that the INTERGROWTH-21st standard performed better than the Hadlock standard for the prediction of NICU admission and mechanical ventilation (P < 0.05 for both). Although fetuses with EFW > 90th percentile were also at risk for any adverse perinatal outcome according to the INTERGROWTH-21st (RR = 1.4; 95% CI, 1.0-1.9) and Hadlock (RR = 1.7; 95% CI, 1.1-2.6) standards, many times fewer cases (2-5-fold lower sensitivity) were detected by using EFW > 90th percentile, rather than EFW < 10th percentile, in screening by these standards.
Conclusions: Fetuses with EFW < 10th percentile or EFW > 90th percentile were at increased risk of adverse perinatal outcomes according to all or some of the eight growth standards, respectively. The RR of a composite adverse perinatal outcome in pregnancies with EFW < 10th percentile was higher for the most-stringent (NICHD) compared with the least-stringent (FMF) standard. The results of the complementary analysis of AUC suggest slightly improved detection of adverse perinatal outcome by more recent population-based (INTERGROWTH-21st ) and customized (PRB/NICHD) standards compared with the Hadlock and FMF standards. Published 2019. This article is a U.S. Government work and is in the public domain in the USA.
Keywords: customized fetal growth standards; estimated fetal weight; growth restriction; mechanical ventilation; neonatal intensive care unit admission; perinatal morbidity; perinatal mortality.
Published 2019. This article is a U.S. Government work and is in the public domain in the USA.
Conflict of interest statement
Figures
Similar articles
-
A new customized fetal growth standard for African American women: the PRB/NICHD Detroit study.Am J Obstet Gynecol. 2018 Feb;218(2S):S679-S691.e4. doi: 10.1016/j.ajog.2017.12.229. Am J Obstet Gynecol. 2018. PMID: 29422207 Free PMC article.
-
Reduced fetal growth velocity precedes antepartum fetal death.Ultrasound Obstet Gynecol. 2021 Jun;57(6):942-952. doi: 10.1002/uog.23111. Ultrasound Obstet Gynecol. 2021. PMID: 32936481 Free PMC article.
-
Two-stage approach for prediction of small-for-gestational-age neonate and adverse perinatal outcome by routine ultrasound examination at 35-37 weeks' gestation.Ultrasound Obstet Gynecol. 2019 Oct;54(4):484-491. doi: 10.1002/uog.20391. Epub 2019 Aug 27. Ultrasound Obstet Gynecol. 2019. PMID: 31271475
-
Estimated fetal weight standards of the INTERGROWTH-21st project for the prediction of adverse outcomes: a systematic review with meta-analysis.J Matern Fetal Neonatal Med. 2023 Dec;36(2):2230510. doi: 10.1080/14767058.2023.2230510. J Matern Fetal Neonatal Med. 2023. PMID: 37408129
-
Severe smallness as predictor of adverse perinatal outcome in suspected late small-for-gestational-age fetuses: systematic review and meta-analysis.Ultrasound Obstet Gynecol. 2022 Sep;60(3):328-337. doi: 10.1002/uog.24977. Ultrasound Obstet Gynecol. 2022. PMID: 35748873
Cited by
-
Fetal Growth Restriction Prediction: How to Move beyond.ScientificWorldJournal. 2019 Aug 21;2019:1519048. doi: 10.1155/2019/1519048. eCollection 2019. ScientificWorldJournal. 2019. PMID: 31530999 Free PMC article. Review.
-
Customized versus Population Growth Standards for Morbidity and Mortality Risk Stratification Using Ultrasonographic Fetal Growth Assessment at 22 to 29 Weeks' Gestation.Am J Perinatol. 2021 Aug;38(S 01):e46-e56. doi: 10.1055/s-0040-1705114. Epub 2020 Mar 20. Am J Perinatol. 2021. PMID: 32198743 Free PMC article.
-
AI-based analysis of fetal growth restriction in a prospective obstetric cohort quantifies compound risks for perinatal morbidity and mortality and identifies previously unrecognized high risk clinical scenarios.Res Sq [Preprint]. 2024 Dec 16:rs.3.rs-5126218. doi: 10.21203/rs.3.rs-5126218/v1. Res Sq. 2024. Update in: BMC Pregnancy Childbirth. 2025 Jan 30;25(1):80. doi: 10.1186/s12884-024-07095-6. PMID: 39764132 Free PMC article. Updated. Preprint.
-
Fetal growth percentile software: a tool to calculate estimated fetal weight percentiles for 6 standards.Am J Obstet Gynecol. 2020 Jun;222(6):625-628. doi: 10.1016/j.ajog.2020.02.006. Epub 2020 Feb 15. Am J Obstet Gynecol. 2020. PMID: 32067969 Free PMC article. No abstract available.
-
Abnormal Maternal Body Mass Index and Customized Fetal Weight Charts: Improving the Identification of Small for Gestational Age Fetuses and Newborns.Nutrients. 2023 Jan 22;15(3):587. doi: 10.3390/nu15030587. Nutrients. 2023. PMID: 36771294 Free PMC article.
References
-
- Schoendorf KC, Hogue CJ, Kleinman JC, Rowley D. Mortality among infants of black as compared with white college-educated parents. The New England journal of medicine 1992; 326: 1522–1526. - PubMed
-
- Gardosi J, Mul T, Mongelli M, Fagan D. Analysis of birthweight and gestational age in antepartum stillbirths. British journal of obstetrics and gynaecology 1998; 105: 524–530. - PubMed
-
- McIntire DD, Bloom SL, Casey BM, Leveno KJ. Birth weight in relation to morbidity and mortality among newborn infants. The New England journal of medicine 1999; 340: 1234–1238. - PubMed
-
- Alexander GR, Kogan MD, Himes JH. 1994–1996 U.S. singleton birth weight percentiles for gestational age by race, Hispanic origin, and gender. Maternal and child health journal 1999; 3: 225–231. - PubMed
-
- Ozanne SE, Fernandez-Twinn D, Hales CN. Fetal growth and adult diseases. Seminars in perinatology 2004; 28: 81–87. - PubMed
