

Preclinical Assessment of Leptin Transport into the Cerebrospinal Fluid in Diet-Induced Obese Minipigs
- PMID: 31006983
- PMCID: PMC6593767
- DOI: 10.1002/oby.22465
Preclinical Assessment of Leptin Transport into the Cerebrospinal Fluid in Diet-Induced Obese Minipigs
Abstract
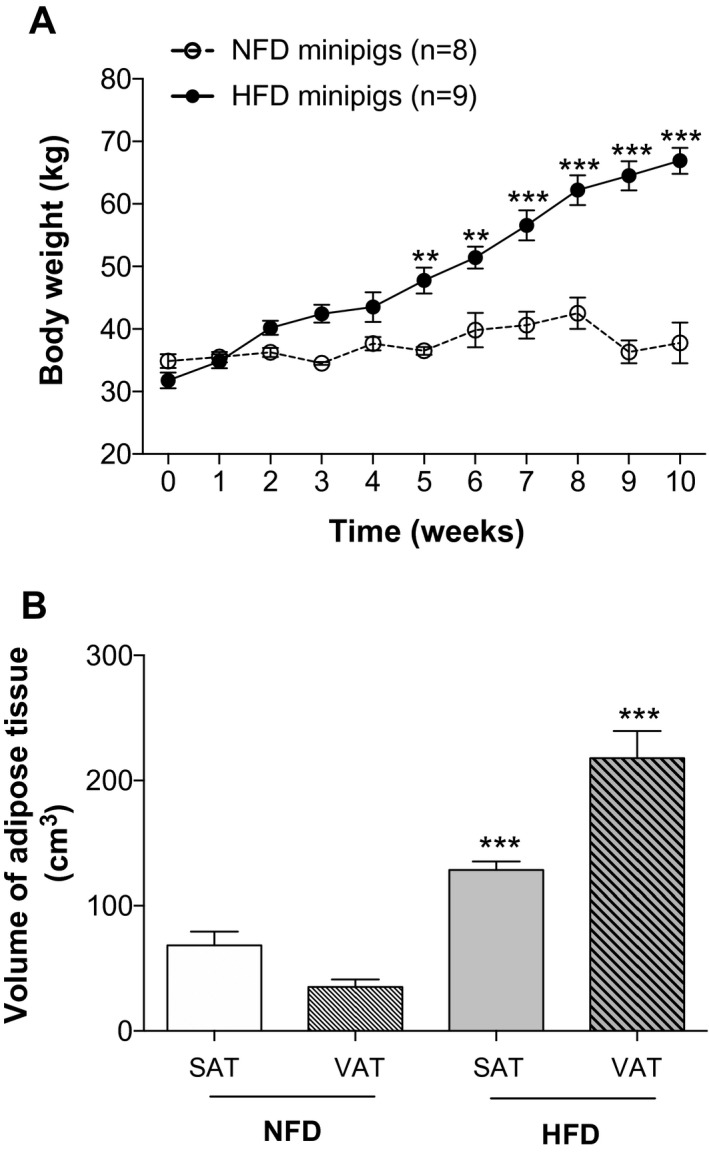
Objective: A minipig model was employed to explore the changes in endogenous leptin transport into the central nervous system and in hypothalamic sensitivity to exogenous leptin when individuals are placed on high-fat diet (HFD) compared with standard diet.
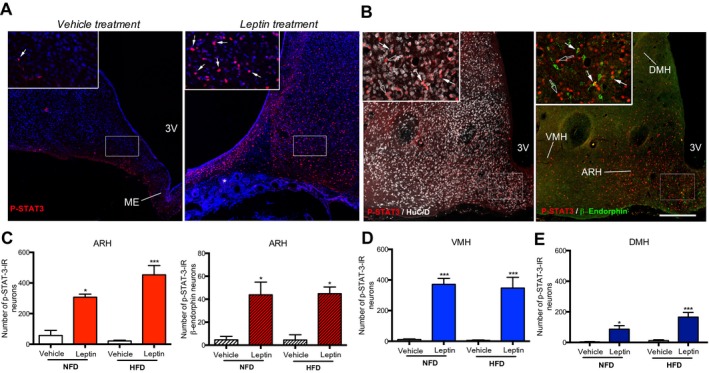
Methods: Serum and cerebrospinal fluid (CSF) leptin concentrations during 10 weeks of HFD versus standard diet and exogenous leptin-induced STAT3 phosphorylation in the hypothalamus of minipigs were assessed, and the hypothalamic leptin-sensitive cells were characterized by immunofluorescence.
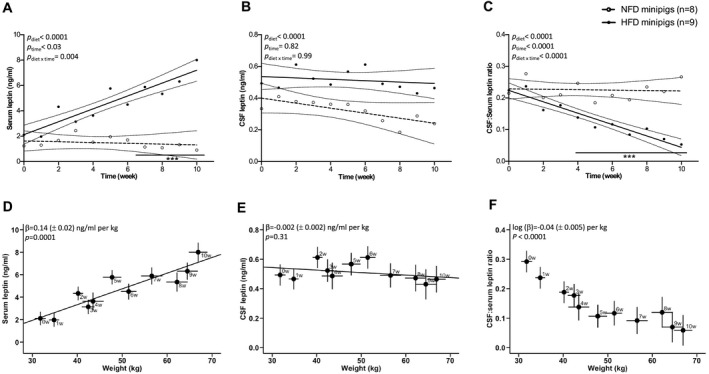
Results: The efficiency of the passage of endogenous blood-borne leptin into the CSF (measured as the log [CSF:serum leptin ratio]) decreased over time in minipigs fed a HFD (β = -0.04 ± 0.005 per kilogram of weight gain in HFD; P < 0.0001), while it remained stable in minipigs fed a standard diet. However, the ability of peripherally administered leptin to activate its receptor in hypothalamic neurons was preserved in obese minipigs at 10 weeks of HFD.
Conclusions: Together, these data are consistent with the existence of an early-onset tranport deficiency for endogenous circulating leptin into the brain in individuals developing obesity, preceding the acquisition of hypothalamic leptin resistance. Although additional studies are required to identify the underlying mechanisms, our study paves the way for the development of new preclinical pharmacological models targeting the restoration of the shuttling of peripheral leptin into the central nervous system to manage obesity.
© 2019 The Authors. Obesity published by Wiley Periodicals, Inc. on behalf of The Obesity Society (TOS).
Figures
References
-
- Frederich RC, Hamann A, Anderson S, Löllmann B, Lowell BB, Flier JS. Leptin levels reflect body lipid content in mice: evidence for diet‐induced resistance to leptin action. Nat Med 1995;1:1311‐1314. - PubMed
-
- Coppari R, Ichinose M, Lee CE, et al. The hypothalamic arcuate nucleus: a key site for mediating leptin’s effects on glucose homeostasis and locomotor activity. Cell Metab 2005;1:63‐72. - PubMed
-
- Pan WW, Myers MG. Leptin and the maintenance of elevated body weight. Nat Rev Neurosci 2018;19:95‐105. - PubMed
-
- Schwartz MW, Peskind E, Raskind M, Boyko EJ, Porte D. Cerebrospinal fluid leptin levels: relationship to plasma levels and to adiposity in humans. Nat Med 1996;2:589‐593. - PubMed
Publication types
MeSH terms
Substances
LinkOut - more resources
Full Text Sources
Medical
Miscellaneous
