. 2020 Feb;16(2):271-288.
doi: 10.1080/15548627.2019.1606647. Epub 2019 Apr 21.

MTORC1 coordinates the autophagy and apoptosis signaling in articular chondrocytes in osteoarthritic temporomandibular joint

Affiliations

MTORC1 coordinates the autophagy and apoptosis signaling in articular chondrocytes in osteoarthritic temporomandibular joint

Hongxu Yang et al. Autophagy. 2020 Feb.

Abstract

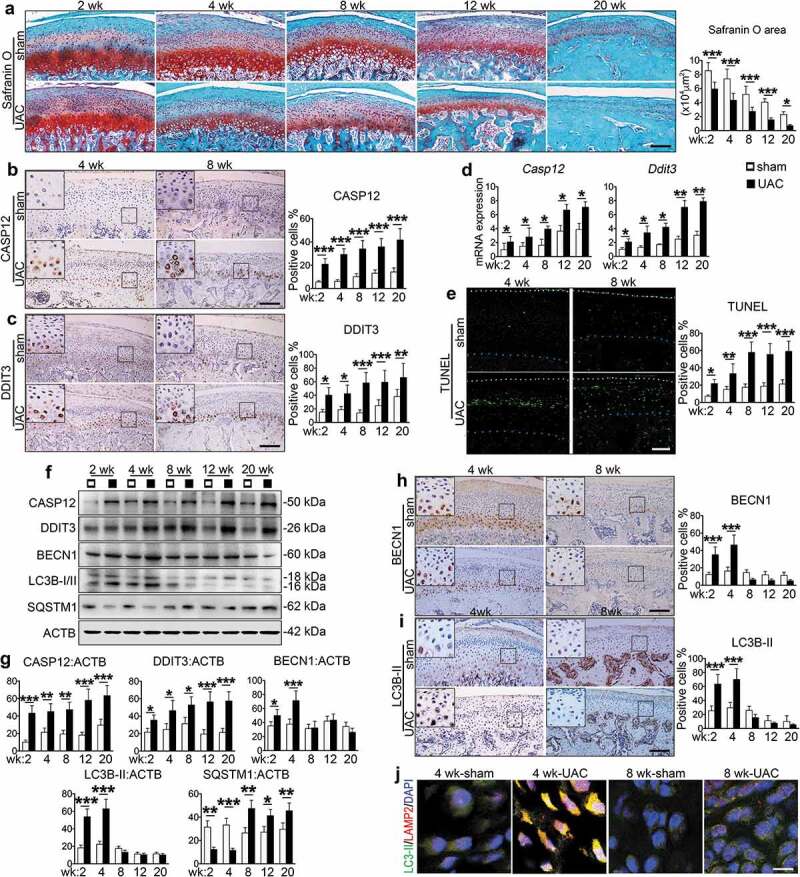
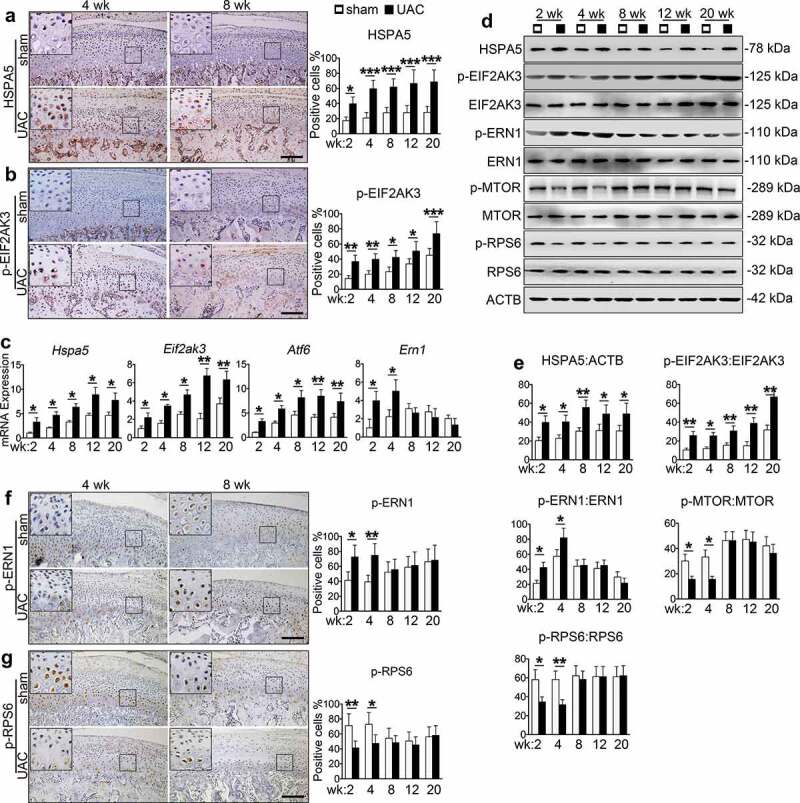
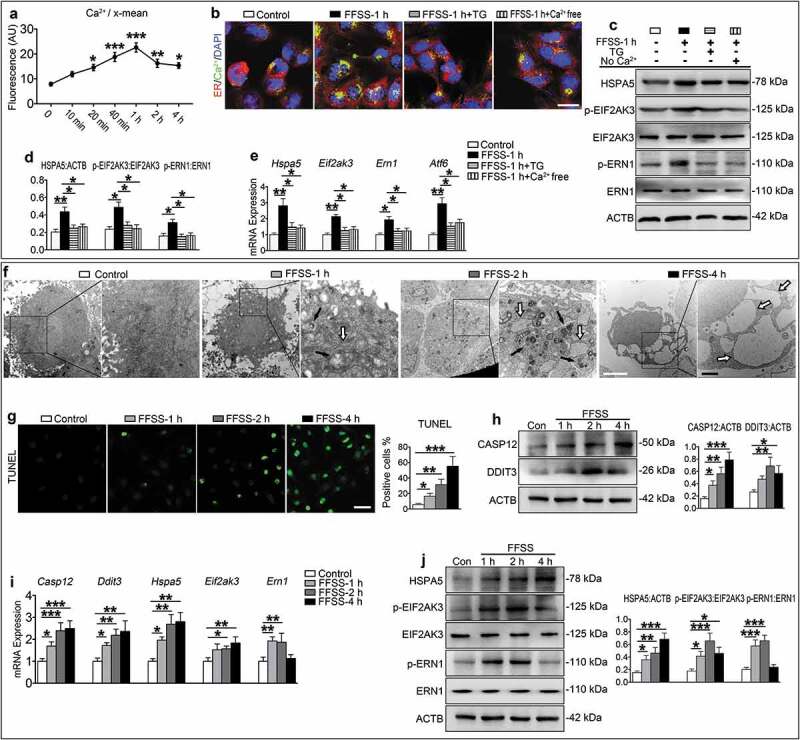
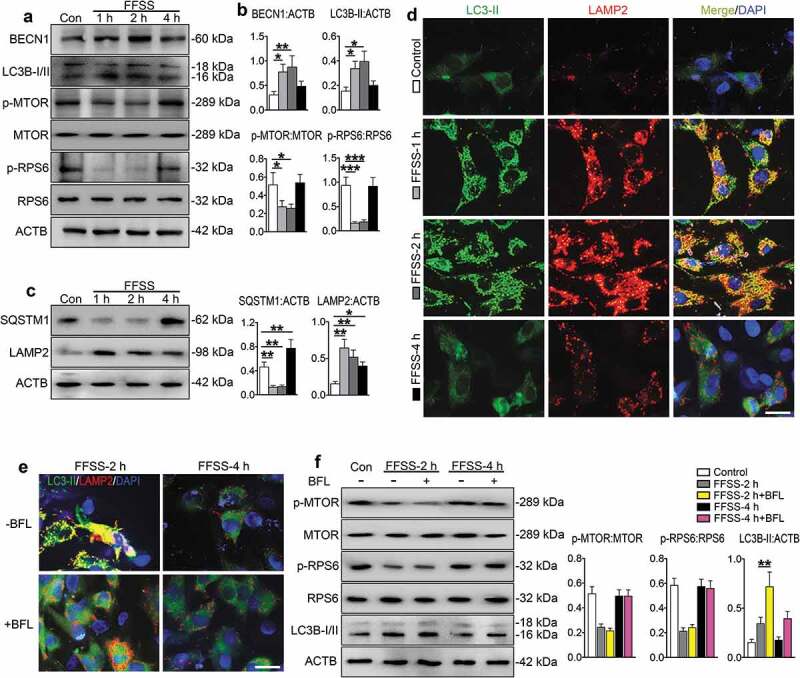
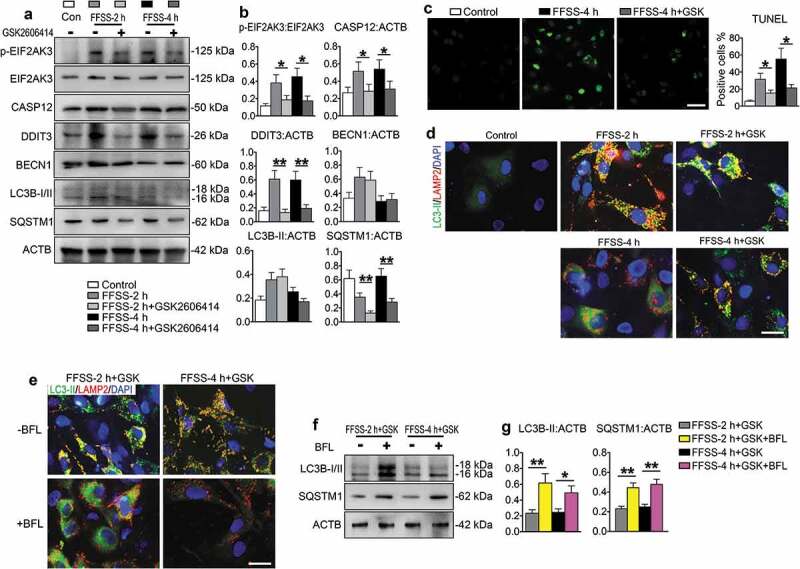
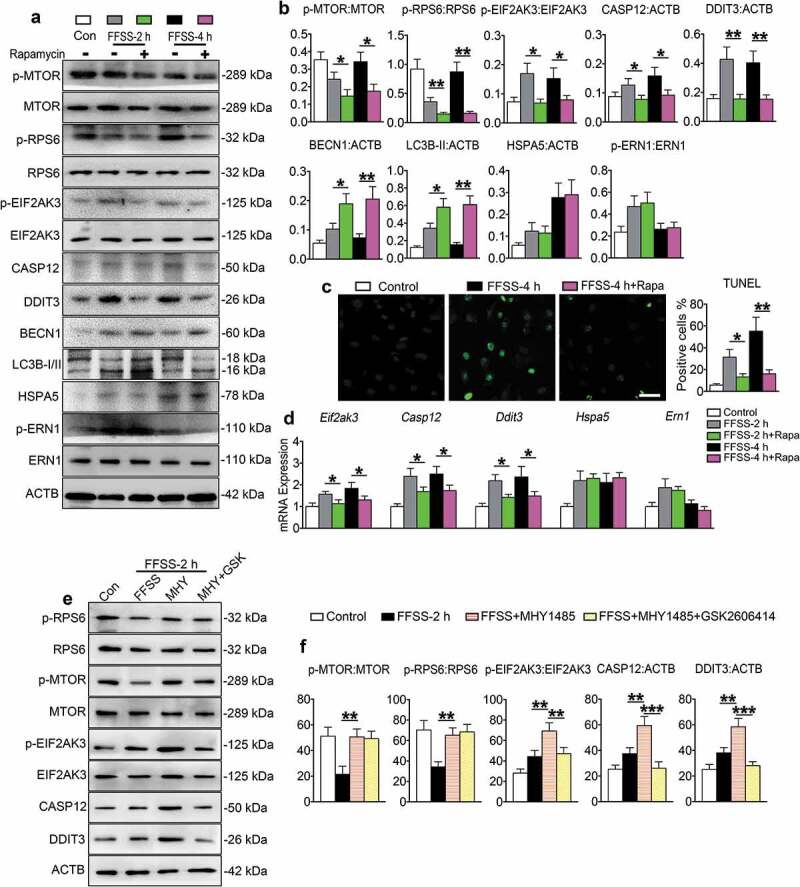
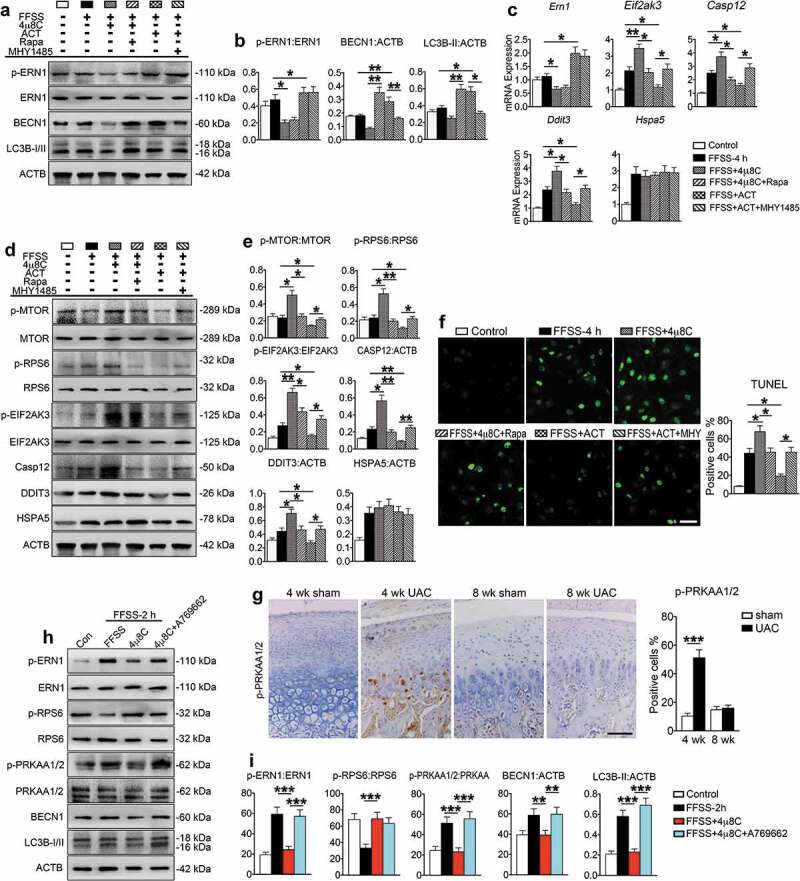
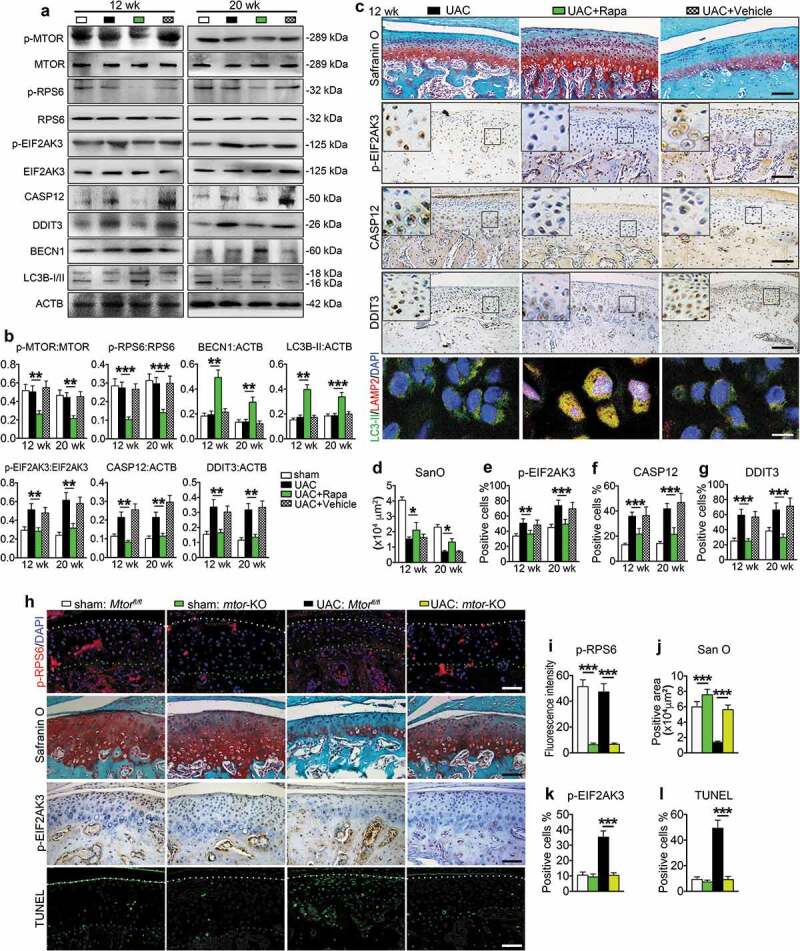
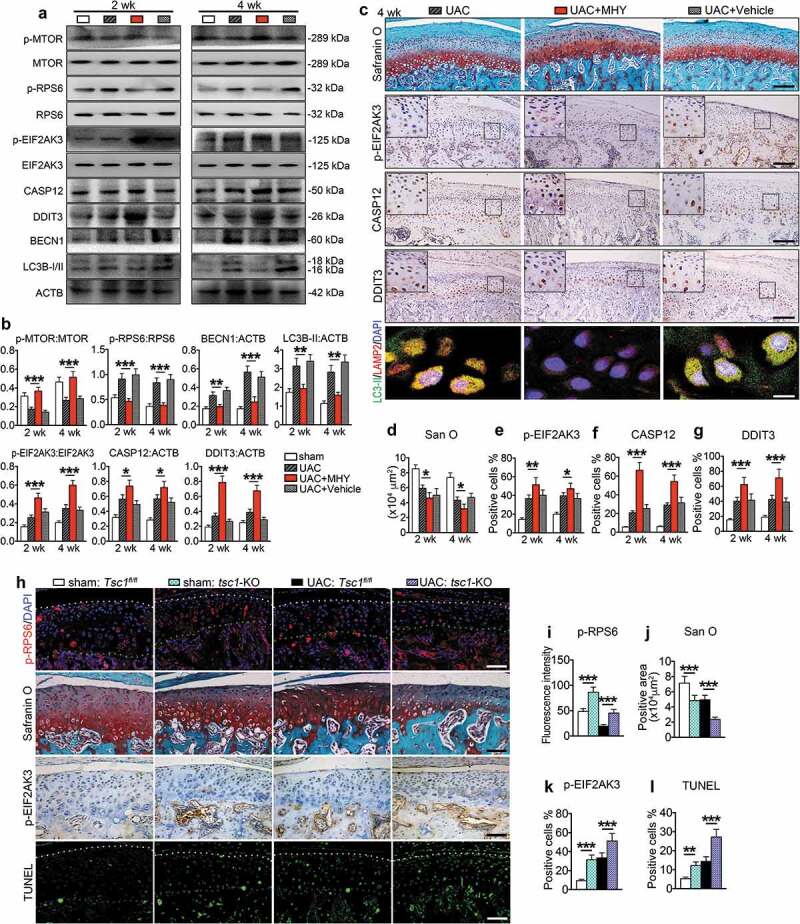
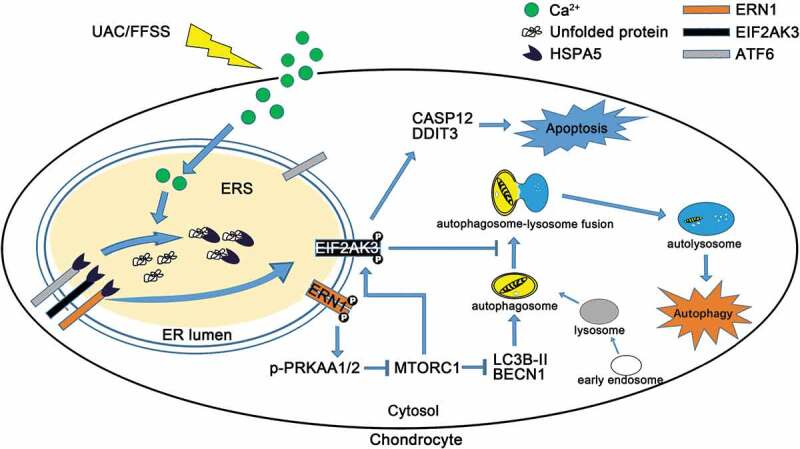
A switch from autophagy to apoptosis is implicated in chondrocytes during the osteoarthritis (OA) progression with currently unknown mechanism(s). In this study we utilized a flow fluid shear stress (FFSS) model in cultured chondrocytes and a unilateral anterior crossbite (UAC) animal model. We found that both FFSS and UAC actively induced endoplasmic reticulum stress (ERS) in the temporomandibular joints (TMJ) chondrocytes, as demonstrated by dramatic increases in expression of HSPA5, p-EIF2AK3, p-ERN1 and ATF6. Interestingly, both FFSS and UAC activated not only pro-death p-EIF2AK3-mediated ERS-apoptosis programs but also pro-survival p-ERN1-mediated autophagic flux in chondrocytes. Data from FFSS demonstrated that MTORC1, a downstream of p-ERN1, suppressed autophagy but promoted p-EIF2AK3 mediated ERS-apoptosis. Data from UAC model demonstrated that at early stage both the p-ERN1 and p-EIF2AK3 were activated and MTORC1 was inhibited in TMJ chondrocytes. At late stage, MTORC1-p-EIF2AK3-mediated ERS apoptosis were predominant, while p-ERN1 and autophagic flux were inhibited. Inhibition of MTORC1 by TMJ local injection of rapamycin in rats or inducible ablation of MTORC1 expression selectively in chondrocytes in mice promoted chondrocyte autophagy and suppressed apoptosis, and reduced TMJ cartilage loss induced by UAC. In contrast, MTORC1 activation by TMJ local administration of MHY1485 or genetic deletion of Tsc1, an upstream MTORC1 suppressor, resulted in opposite effects. Collectively, our results establish that aberrant mechanical loading causes cartilage degeneration by activating, at least in part, the MTORC1 signaling which modulates the autophagy and apoptosis programs in TMJ chondrocytes. Thus, inhibition of MTORC1 provides a novel therapeutic strategy for prevention and treatment of OA.Abbreviations : ACTB: actin beta; ATF6: activating transcription factor 6; BECN1: beclin 1; BFL: bafilomycin A1; CASP12: caspase 12; CASP3: caspase 3; DAPI: 4',6-diamidino-2-phenylindole; DDIT3: DNA-damage inducible transcript 3; EIF2AK3/PERK: eukaryotic translation initiation factor 2 alpha kinase 3; ER: endoplasmic reticulum; ERS: endoplasmic reticulum stress; ERN1/IRE1: endoplasmic reticulum to nucleus signaling 1; FFSS: flow fluid shear stress; HSPA5/GRP78/BiP: heat shock protein 5; LAMP2: lysosome-associated membrane protein 2; MAP1LC3B/LC3B: microtubule associated protein 1 light chain 3 beta; MTOR: mechanistic target of rapamycin kinase; MTORC1: mechanistic target of rapamycin complex 1; OA: osteoarthritis; PRKAA1/2/AMPK1/2: protein kinase, AMP-activated, alpha 1/2 catalytic subunit; RPS6: ribosomal protein S6; Rapa: rapamycin; SQSTM1/p62: sequestosome 1; TEM: transmission electron microscopy; TG: thapsigargin; TMJ: temporomandibular joints; TSC1/2: tuberous sclerosis complex 1/2; UAC: unilateral anterior crossbite; UPR: unfolded protein response; XBP1: x-box binding protein 1.

Keywords: Autophagy; chondrocyte; endoplasmic reticulum stress; endoplasmic reticulum to nucleus signaling 1; eukaryotic translation initiation factor 2 alpha kinase 3; mechanistic target of rapamycin complex 1; osteoarthritis.


Figures

Figure 1.
Figure 1.
Effects of UAC on ERS-apoptosis signaling and autophagic flux in chondrocytes in rat TMJ cartilage. (a) Safranin O staining of condylar cartilage. Sagittal central section of TMJ in sham and UAC group from 2 to 20 wk. Scale bar: 200 μm. Quantitative data of cartilage area (right panel). (b and c) Immunohistochemistry (IHC) staining using antibodies against CASP12 and DDIT3 at 4 and 8 wk. Quantitative data of CASP12- and DDIT3-positive cells in each group are shown (right panels). Scale bar: 200 μm. (d) Real-time RT-PCR (qPCR) analyses for the mRNA expression of Casp12 and Ddit3 from rat TMJ in sham and UAC group. (e) TUNEL staining. Quantitative data of percentage of TUNEL-positive cells in each group (right panel). White dots, superficial condylar cartilage; blue dots, the border between cartilage and subchondral bone. Scale bar: 100 μm. (f) Western blotting for the protein expression of CASP12, DDIT3, BECN1, LC3B-I/II and SQSTM1. (g) Quantitative data of (f). (h and i) IHC staining for BECN1 and LC3B-II. Quantitative data of positive cells (right panels). (j) Immunofluorescence (IF) staining for autophagosome and lysosome location. LC3B-II puncta, green; LAMP2 puncta, red; DAPI, blue. Scale bar, 10 μm. Results are expressed as mean ± standard deviation. Safranin O and IHC staining: N = 6. Western blotting and qPCR analysis: N = 3. * P < 0.05, ** P < 0.01 and *** P < 0.001 represent significant differences between the indicated groups.
Figure 2.
Figure 2.
Effects of UAC on MTORC1 and ERS signaling in chondrocytes in rat TMJ cartilage. (a and b) IHC staining using antibodies against HSPA5 and p-EIF2AK3 at 4 and 8 wk. Quantitative data of HSPA5- and p-EIF2AK3-positive cells in each group are shown (right panels). Scale bar, 200 μm. (c) qPCR analyses for the mRNA expression of Hspa5, Eif2ak3, Atf6 and Ern1 from rat TMJ in sham and UAC group. (d) Western blotting for HSPA5, p-EIF2AK3, EIF2AK3, p-ERN1, ERN1, p-MTOR, MTOR, p-RPS6 and RPS6. (e) Quantitative data of (d). (f and g) IHC staining against p-ERN1 and p-RPS6 at 4 and 8 wk. Quantitative data of the positive cells in each group are shown (right panels). Scale bar: 200 μm. Results are expressed as mean ± standard deviation. IHC staining: N = 6. Western blotting and qPCR analysis: N = 3. * P < 0.05, ** P < 0.01 and *** P < 0.001 represent significant differences between the indicated groups.
Figure 3.
Figure 3.
FFSS activates ERS-apoptosis in cultured ATDC5 cells through the Ca2+ overload. (a) ATDC5 cells were exposed to 24 dyne/cm2 FFSS for the indicated times and stained with a calcium fluorescence dye, followed by flow cytometry for measurement of Ca2+ content in the ER. (b) ATDC5 cells were exposed to 24 dyne/cm2 FFSS for 1 h and treated with 10 μM thapsigargin (TG) or medium without calcium (Ca2+ free). Representative images of each group are shown. Calcium, green; ER, red. Scale bar: 10 μm. (c) Western blotting for protein expression of HSPA5, p-EIF2AK3, EIF2AK3, p-ERN1 and ERN1. (d). Quantitative data of (c). (e) qPCR analyses for the mRNA expression of Hspa5, Eif2ak3, Ern1 and Atf6. (f) ATDC5 cells were subjected to 24 dyne/cm2 FFSS for 1, 2 and 4 h. TEM images of ATDC5 cells with 6000X (left panels) and 16500X (right panels) are shown. Black arrows, the incompletely digested organelle and lysosomal enzyme granules; white arrows, the expansion of ER. White bar: 2 μm. Black bar: 1 μm. (g) ATDC5 cells were treated as in (f) and subjected to TUNEL staining. Quantitative data of TUNEL-positive cells (right panel). Scale bar: 50 μm. (h-j) ATDC5 cells were treated as in (f), followed by western blotting or qPCR analyses for expression of the indicated genes. Quantitative data are presented in the respective right panels. Results are expressed as mean ± standard deviation. N = 3. * P < 0.05, ** P < 0.01 and *** P < 0.001 represent significant differences between the indicated groups.
Figure 4.
Figure 4.
FFSS activates autophagic flux but inactivates MTORC1 pathways in cultured ATDC5 cells. (a) ATDC5 cells were exposed to 24 dyne/cm2 FFSS for the indicated times and western blot for measurement of indicated protein expression. (b) Quantitative data of (a). (c) Western blotting for protein expression of SQSTM1/p62 and LAMP2 for detecting autophagic flux. (d). ATDC5 cells were treated as in (a). IF staining for locating the autophagosome and lysosome stations. Representative images of each group are shown. LC3B-II, green; LAMP2, red; DAPI, blue. Scale bar: 10 μm. (e) IF staining from ATDC5 cell stimulated with 2 and 4 h FFSS treatment with bafilomycin A1 (BFL). LC3B-II, green; LAMP2, red; DAPI, blue. Scale bar: 10 μm. (f) Western blotting for protein expression in ATDC5 cells which were subjected to 24 dyne/cm2 FFSS for 2 and 4 h with or without bafilomycin A1 treatment. Quantitative data are presented in the respective right panels. Results are expressed as mean ± standard deviation. N = 3. * P < 0.05, ** P < 0.01 and *** P < 0.001 represent significant differences between the indicated groups.
Figure 5.
Figure 5.
Effects of p-EIF2AK3 inhibition on ERS-apoptosis and autophagy in FFSS-treated chondrocytes. (a and b) ATDC5 cells were subjected to 24 dyne/cm2 FFSS for 2 or 4 h with or without 1 μM GSK2606414, followed by western blotting for expression of the indicated genes. (c) ATDC5 cells were first treated with GSK2606414 and, then, subjected to FFSS as in (a, b), followed by TUNEL staining. (d) ATDC5 cells were first treated with GSK2606414 and then subjected to FFSS as in (a, b), followed by IF staining for locating the autophagosome and lysosome stations. LC3B-II, green; LAMP2, red; DAPI, blue. Scale bar: 10 μm. (e) IF staining from ATDC5 cell stimulated with 2 and 4 h FFSS and treated with GSK2606414 and with or without bafilomycin A1 (BFL). LC3B-II, green; LAMP2, red; DAPI, blue. Scale bar: 10 μm. (f) Western blotting for protein expression of LC3B-I/II and SQSTM1/p62 in ATDC5 cells which were subjected to as in (e). (g) Quantitative data of (f). N = 3. * P < 0.05, ** P < 0.01 and *** P < 0.001 represent significant differences between the indicated groups.
Figure 6.
Figure 6.
MTORC1 promotes p-EIF2AK3-mediated ERS-apoptosis, but suppresses autophagy, in chondrocytes in the presence of FFSS. (a-d) ATDC5 cells were treated with or without 100 nM rapamycin and then subjected to 24 dyne/cm2 FFSS for 2 or 4 h, followed by western blotting (a and b) or TUNEL staining (c) or qPCR analyses (d) for expression of the indicated genes. Scale bar: 50 μm. (e and f) Western blot analysis of p-RPS6, RPS6, p-MTOR, MTOR, p-EIF2AK3, EIF2AK3, CASP12 and DDIT3 expression in ATDC5 cells with 1 μM MHY1485 or 1 μM GSK2606414 treatment or both. N = 3. * P < 0.05, ** P < 0.01 and *** P < 0.001 represent significant differences between the indicated groups.
Figure 7.
Figure 7.
p-ERN1 inhibits MTORC1 to attenuate ERS-apoptosis in FFSS-treated chondrocytes. (a-f) The ATDC5 cells were treated with 4μ8C (1 μM), rapamycin (100 nM), 4μ8C (1 μM) + rapamycin (100 nM), infection of ERN1 lentivirus (ACT), or ACT + MHY1485 (100 nM). Two h later, cells were subjected with FFSS (dyne/cm2) for 4 h, followed by western blotting (a, b, d, and e) and qPCR analysis (c) for expression of the indicated genes, or TUNEL staining for cell apoptosis (f). Scale bar, 50 μm. (g) IHC staining using antibody against p-PRKAA1/2 at 4 and 8 wk. Quantitative data of the positive cells in each group are shown (right panels). Scale bar: 100 μm. (h and i) Western blot analysis of indicated markers in ATDC5 cells with 1 μM 4μ8C or 1 μM A769662 treatment or both. Results are expressed as mean ± standard deviation. N = 3. * P < 0.05, **P < 0.01 and *** P < 0.001 represent significant differences between the indicated groups.
Figure 8.
Figure 8.
MTORC1 inactivation promotes chondrocyte autophagy, suppresses chondrocyte apoptosis and prevents cartilage loss under UAC. (a and b) Injection of 100 nM MTORC1 inhibitor rapamycin (50 μl, Rapa group) or equal volume PBS (vehicle group) in TMJ region of UAC rats from 8 to 12 wk every other day. The samples were harvested after 4 and 12 wk’ injection. Condylar cartilage was prepared for protein extracts for western blotting and its quantification. (c) Sagittal central sections of the condylar cartilage were subjected to safranin O staining for proteoglycans and the positive areas in each group at 12 wk. IHC staining for expression of the p-EIF2AK3, CASP12 and DDIT3. Black scale bar: 100 μm. IF staining for detecting the autophagosome and lysosome location. LC3B-II, green; LAMP2, red; DAPI, blue. White scale bar: 10 μm. (d-g) Quantitative data of cartilage area and p-EIF2AK3-, CASP12- and DDIT3-positive cells in each group are shown. (h) Cartilage-specific deletion of MTORC1 in chondrocytes. Mice were subjected to UAC or sham surgery for 7 wk and injected with TM as described in the Materials and Methods. IF staining: sagittal central sections of the TMJ were stained with antibody against p-RPS6 (S235/236). p-RPS6, red; DAPI, blue. White dots, superficial of condylar cartilage; Green dots, the border between cartilage and subchondral bone. Safranin O (San O) staining. IHC staining of p-EIF2AK3. TUNEL staining. White dots, superficial of condylar cartilage; Blue dots, the border between cartilage and subchondral bone. Scale bar: 100 μm. (i-l) Quantification for (h). Results are expressed as mean ± standard deviation. Safranin O, TUNEL and IHC staining: N = 6 rats, N = 5 mice. Western blotting and qPCR analysis: N = 3. * P < 0.05, ** P < 0.01 and *** P < 0.001 represent significant differences between the indicated groups.
Figure 9.
Figure 9.
MTORC1 activation by MHY1485 or genetic deletion of Tsc1 suppresses chondrocyte autophagy and promotes chondrocyte apoptosis and TMJ cartilage loss in UAC animals. (a) Fifty μl, 100 nM MHY1485 or equal volume PBS was injected into the TMJ region of mice with UAC surgery from 0 wkto 4 wk. Protein extracts were prepared from the condylar cartilage for western blotting for the expression of p-MTOR, p-RPS6, p-EIF2AK3, CASP12, DDIT3, BECN1 and LC3B-I/II. (b) Quantitative data of (a). (c) Sagittal central sections of the condylar cartilage of each group were subjected to Safranin O staining. IHC staining of p-EIF2AK3, CASP12, and DDIT3. Black scale bar, 100 μm. IF staining for autophagosome and lysosome location. LC3B-II, green; LAMP2, red; DAPI, blue. White scale bar: 10 μm. (d-g) Quantitative data of (C). (h) Deletion of Tsc1 in chondrocytes. Mice were subjected to UAC or sham surgery for 3 wk and injected with TM as described in the Materials and Methods. IF staining: sagittal central sections of the TMJ were stained with antibody against p-RPS6 (S235/236). p-RPS6, red; DAPI, blue. White dots, superficial of condylar cartilage; Green dots, the border between cartilage and subchondral bone. Safranin O staining. IHC staining of p-EIF2AK3. TUNEL staining. White dots, superficial of condylar cartilage; Blue dots, the border between cartilage and subchondral bone. Scale bar: 100 μm. (i-l) Quantitative data for (H). Results are expressed as mean ± standard deviation. IHC staining: N = 6 for rat, N = 5 for mice. Western blotting and qPCR analysis: N = 3. * P < 0.05, ** P < 0.01 and *** P < 0.001 represent significant differences between the indicated groups..
Figure 10.
Figure 10.
A working model showing that the role of MTORC1 in the cross-talk between ERS-apoptosis and autophagic flux. UAC-FFSS induces calcium overload, and promotes the ERS by upregulating the p-EIF2AK3 and p-ERN1. Autophagic flux is initiated by the ERN1-MTORC1 signal and ERS-apoptosis is induced by MTORC1-EIF2AK3 in chondrocytes. MTORC1, downstream of p-ERN1-p-PRKAA1/2 (AMPK), switches autophagy to ERS-apoptosis of the chondrocytes in response to prolonged aberrant biomechanical loadings by upregulating p-EIF2AK3, which promotes the expression of CASP12 and DDIT3 that leads to apoptosis and suppresses autophagy by suppressing autophagosome-lysosome fusion.

Similar articles

Cited by

References

    1. Glyn-Jones S, Palmer AJ, Agricola R, et al. Osteoarthritis. Lancet. 2015;386(9991):376–387. PMID: 25748615. - PubMed
    1. Bijlsma JW, Berenbaum F, Lafeber FP.. Osteoarthritis: an update with relevance for clinical practice. Lancet. 2011;377(9783):2115–2126. PMID: 21684382. - PubMed
    1. Caramés B, Taniguchi N, Seino D, et al. Mechanical injury suppresses autophagy regulators and pharmacologic activation of autophagy results in chondroprotection. Arthritis Rheum. 2012;64(4):1182–1192. PMID: 22034068. - PMC - PubMed
    1. Scrivani SJ, Keith DA, Kaban LB.. Temporomandibular disorders. N Engl J Med. 2008;359(25):2693–2705. PMID: 19092154. - PubMed
    1. Zhang M, Yang H, Lu L, et al. Matrix replenishing by BMSCs is beneficial for osteoarthritic temporomandiblar joint cartilage. Osteoarthritis Cartilage. 2017;25(9):1551–1562. PMID: 28532603. - PubMed

Publication types

MeSH terms