Case Reports
. 2019 May;67(5):701-703.
doi: 10.4103/ijo.IJO_1429_18.

Optical coherence tomography angiography in assessment of response to therapy in retinal capillary hemangioblastoma and diffuse choroidal hemangioma

Affiliations
Case Reports

Optical coherence tomography angiography in assessment of response to therapy in retinal capillary hemangioblastoma and diffuse choroidal hemangioma

Pradeep Sagar et al. Indian J Ophthalmol. 2019 May.

Abstract

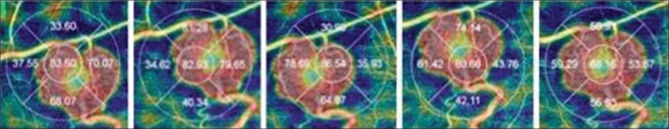
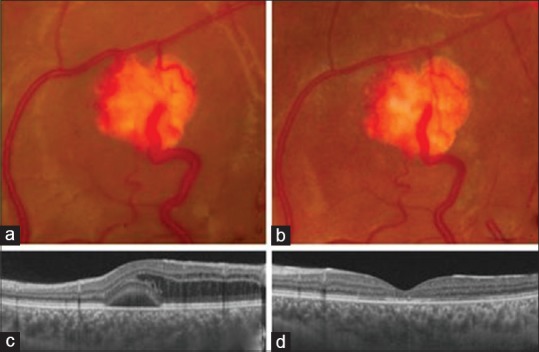
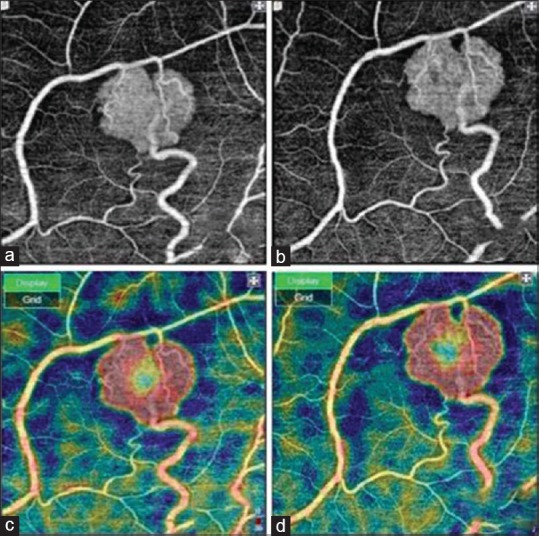
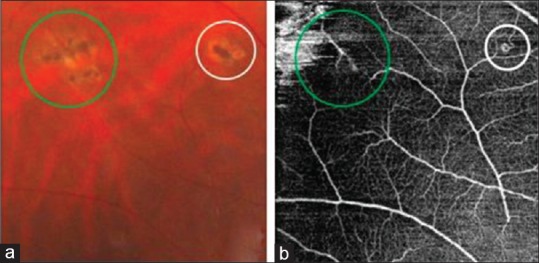
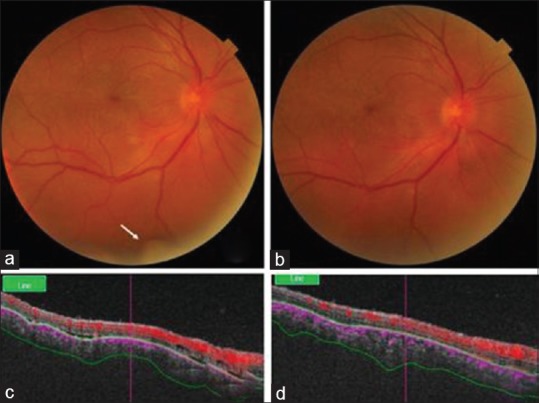
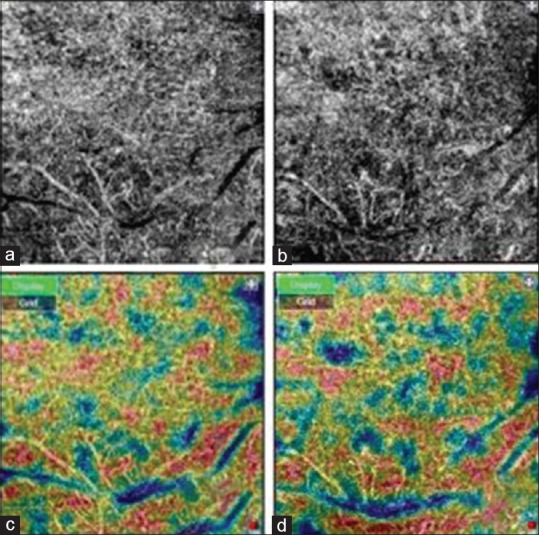
In this series, we discuss the role of optical coherence tomography angiography (OCTA) in assessing response to treatment in intraocular vascular tumors. This is a series of two cases: Multiple retinal capillary hemangioblastoma (RCH) treated with laser photocoagulation and diffuse choroidal hemangioma (DCH) with radiotherapy. In large RCH and DCH, optical coherence tomography (OCT) showed significant reduction of subretinal and intraretinal fluid. But post-treatment mean tumor vascular density (MTVD) was slightly reduced. In one small RCH, vascular loop was seen suggesting minimal residual disease. So, OCTA helps in identifying treatment inadequacy and understanding alternate mechanism involved in treatment response in vascular tumors.

Keywords: Choroidal hemangioma; laser photocoagulation; optical coherence tomography angiography; retinal capillary hemangioblastoma.


Conflict of interest statement

None

Figures

Figure 1
Figure 1
Measurement of mean tumor vascular density (MTVD). The central circle of the grid is positioned on different areas of tumor to include entire tumor area. MTVD is calculated as average of these readings
Figure 2
Figure 2
Case 1: (a) Pretreatment color photograph showing tortuous feeder and draining vessels. (b) Post-treatment color photograph showing minimal whitening of tumor and decrease in the vascular tortuosity. (c) Pretreatment OCT through the fovea showing presence of intraretinal and subretinal fluid. (d) Post-treatment OCT showing resolution of subretinal and intraretinal fluid. Disruption of the ellipsoid zone is seen
Figure 3
Figure 3
Case 1: (a) Pretreatment optical coherence tomography angiography (OCTA). The pre-treatment and post treatment OCTA were segmented manually. (b) Post-treatment OCTA showing minimal increase in signal void areas in the superior half of tumor. (c) Pretreatment OCTA vascular density map (the vascular density is represented as a color map. Violet corresponds to lesser density and red to high density). (d) Post-treatment OCTA vascular density map showing minimal enlargement of central blue zone
Figure 4
Figure 4
Case 1: (a) Color photo showing chorioretinal scar at the site of laser photocoagulation. (b) Absence of abnormal vasculature corresponding to the lesion (within the green circle) indicating complete treatment. Vascular lesion with feeder and draining vessel corresponding to the lesion (within white circle) indicating residual disease
Figure 5
Figure 5
Case 2: (a) Color photograph of diffuse choroidal hemangioma showing inferior exudative retinal detachment (white arrow). (b) Post-treatment color photograph showing decrease in exudative retinal detachment. (c) OCT through diffuse choroidal hemangioma showing undulating choroid with presence of subretinal fluid. (d) Post-treatment OCT showing decrease in choroidal undulation and resolution of subretinal fluid
Figure 6
Figure 6
Case 2: (a): Pretreatment OCTA of choroid. (b) Post-treatment OCTA showing increase in signal void areas. (c) Pretreatment OCTA vascular density map. (d): Post-treatment OCTA vascular density map showing increase in blue zones indicating decrease in vascular density

Similar articles

Cited by

References

    1. Shanmugam PM, Ramanjulu R. Vascular tumors of the choroid and retina. Indian J Ophthalmol. 2015;63:133–40. - PMC - PubMed
    1. Sagar P, Rajesh R, Shanmugam M, Konana VK, Mishra D. Comparison of optical coherence tomography angiography and fundus fluorescein angiography features of retinal capillary hemangioblastoma. Indian J Ophthalmol. 2018;66:872–6. - PMC - PubMed
    1. Konana VK, Shanmugam PM, Ramanjulu R, Mishra KCD, Sagar P. Optical coherence tomography angiography features of choroidal hemangioma. Indian J Ophthalmol. 2018;66:581–3. - PMC - PubMed
    1. Green WR. Retina: Capillary hemangioma. In: Spencer WH, editor. Ophthalmic Pathology: An Atlas and Textbook. Philadelphia: WB Saunders; 1996. pp. 709–18.
    1. Guymer RH, Hageman GS, Bird AC. Influence of laser photocoagulation on choroidal capillary cytoarchitecture. Br J Ophthalmol. 2001;85:40–6. - PMC - PubMed

Publication types

MeSH terms