. 2018;293(3):45.
doi: 10.1007/s11207-018-1259-8. Epub 2018 Feb 23.

On-Orbit Performance of the Helioseismic and Magnetic Imager Instrument onboard the Solar Dynamics Observatory

Affiliations

On-Orbit Performance of the Helioseismic and Magnetic Imager Instrument onboard the Solar Dynamics Observatory

J T Hoeksema et al. Sol Phys. 2018.

Abstract

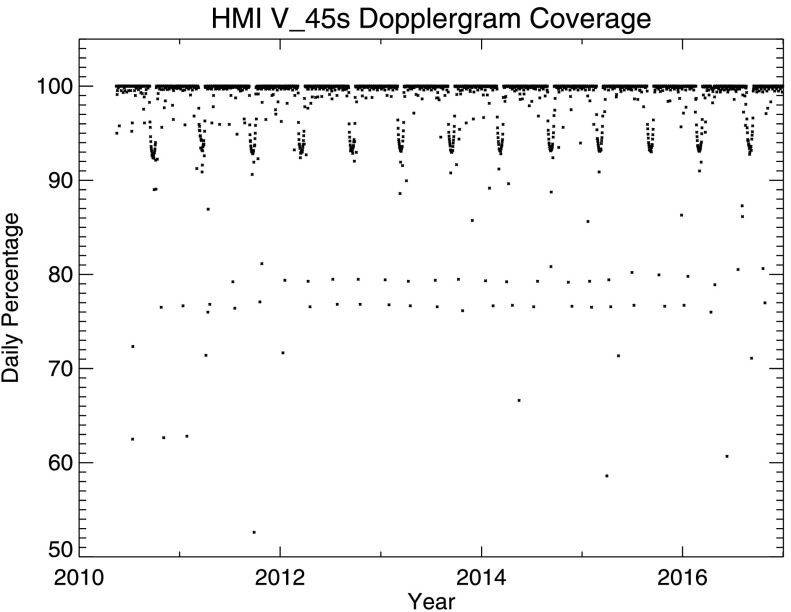
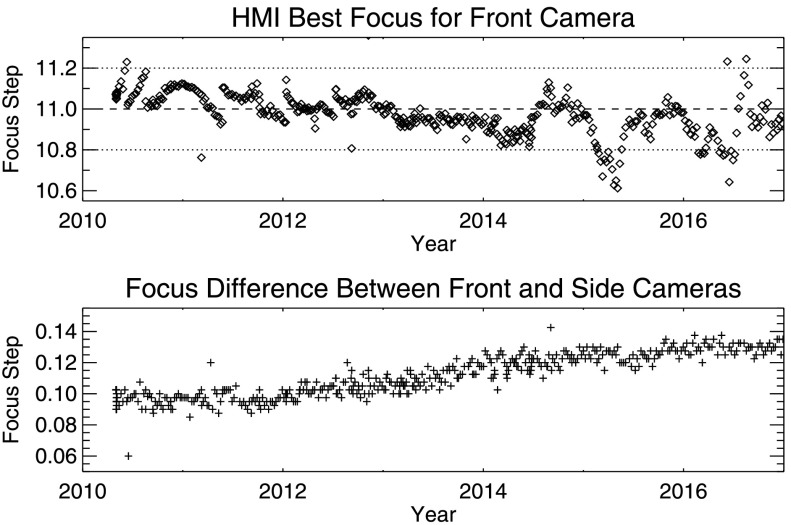
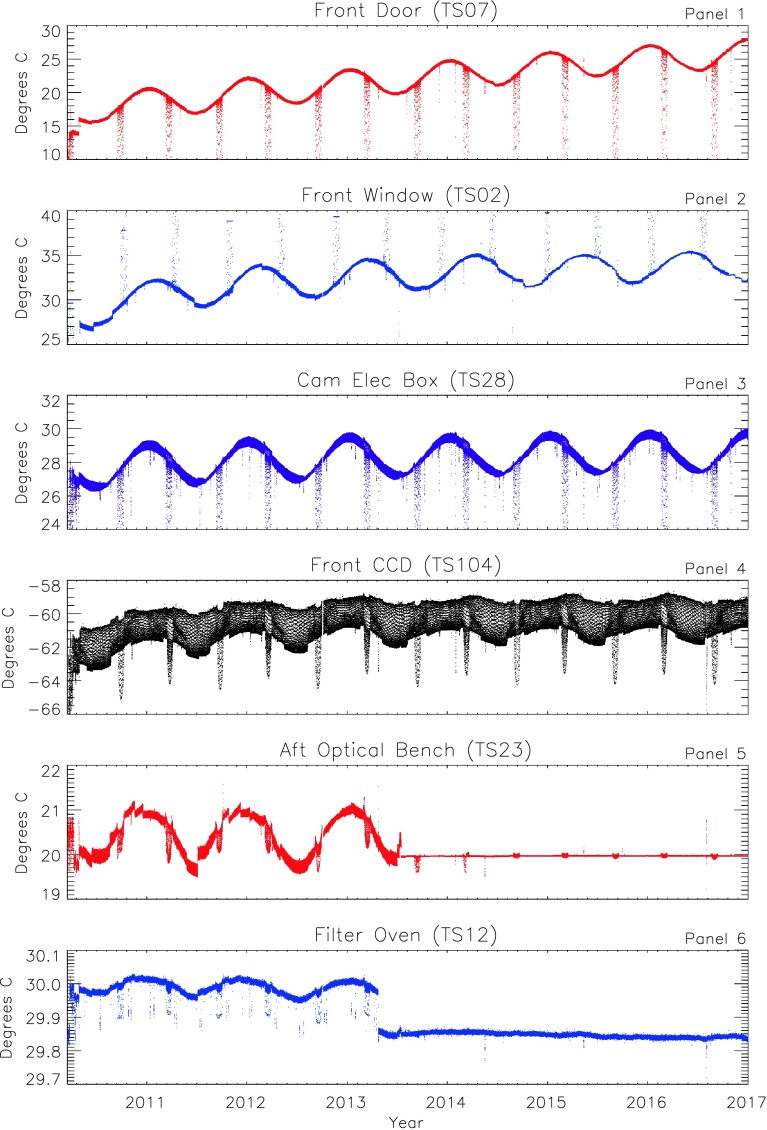
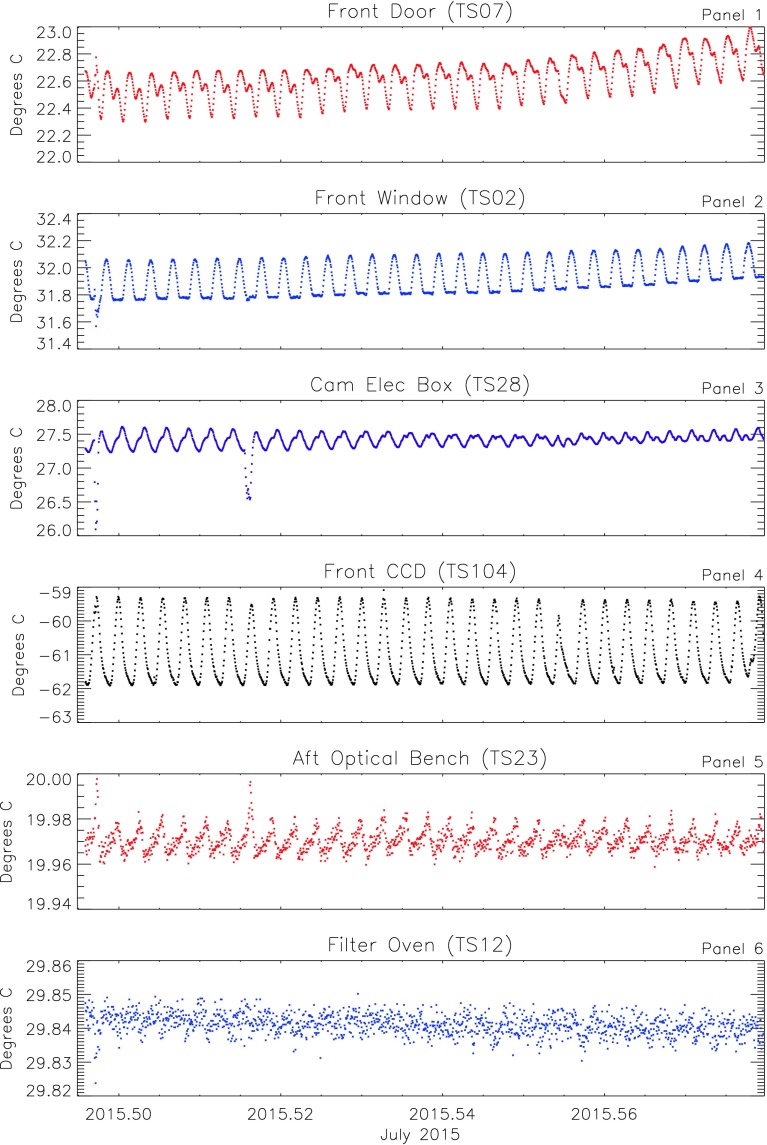
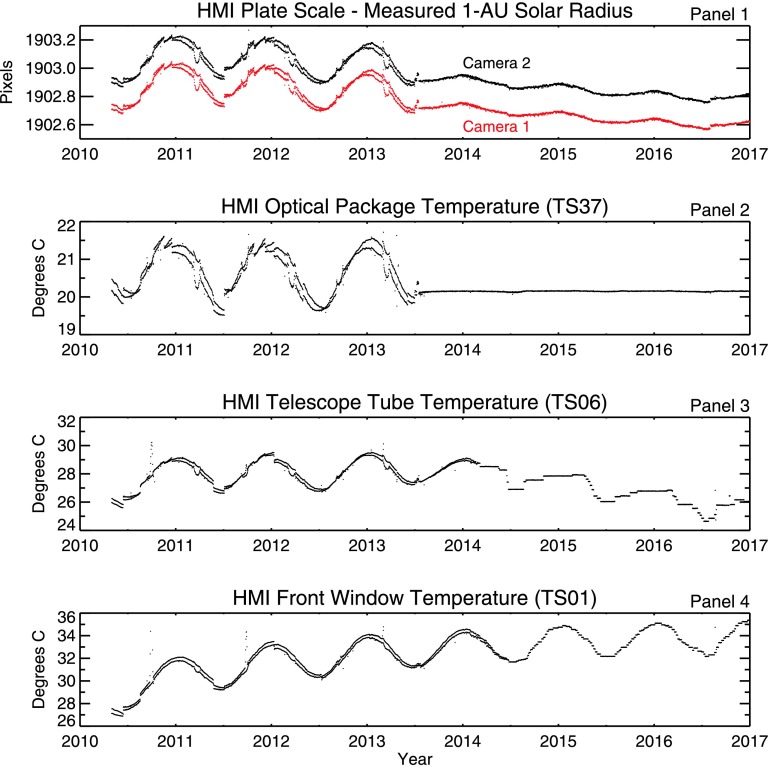
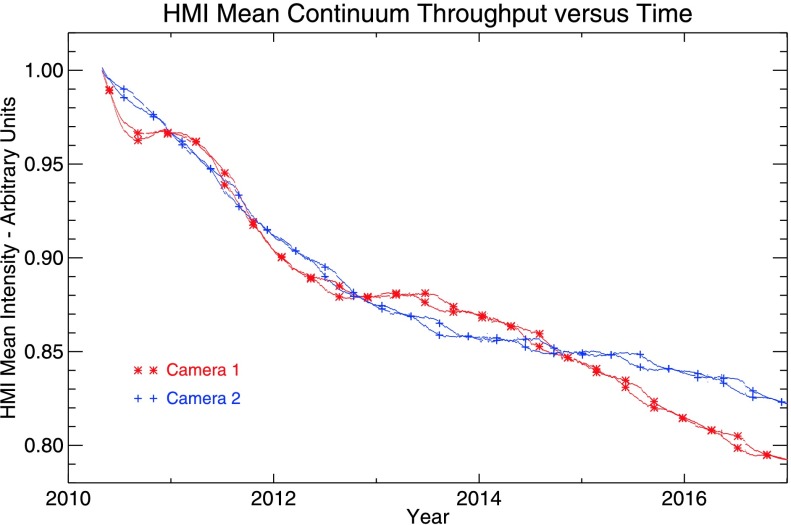
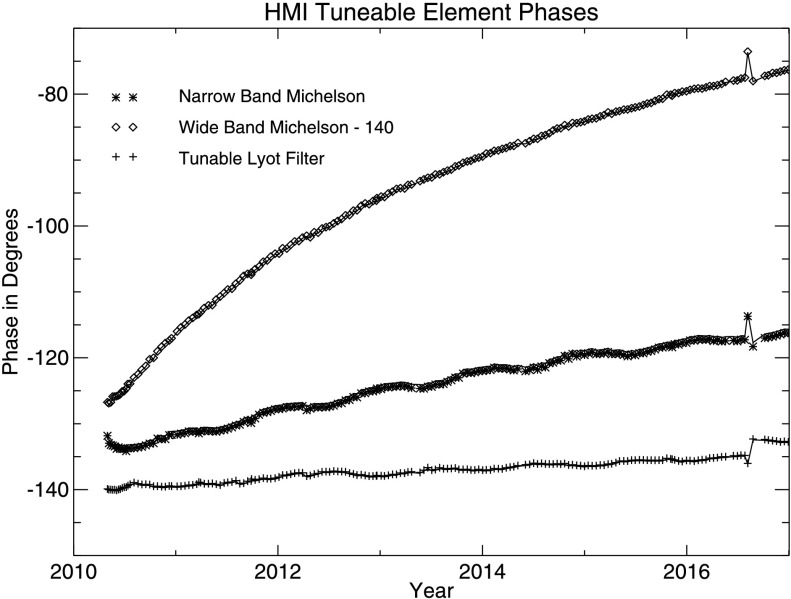
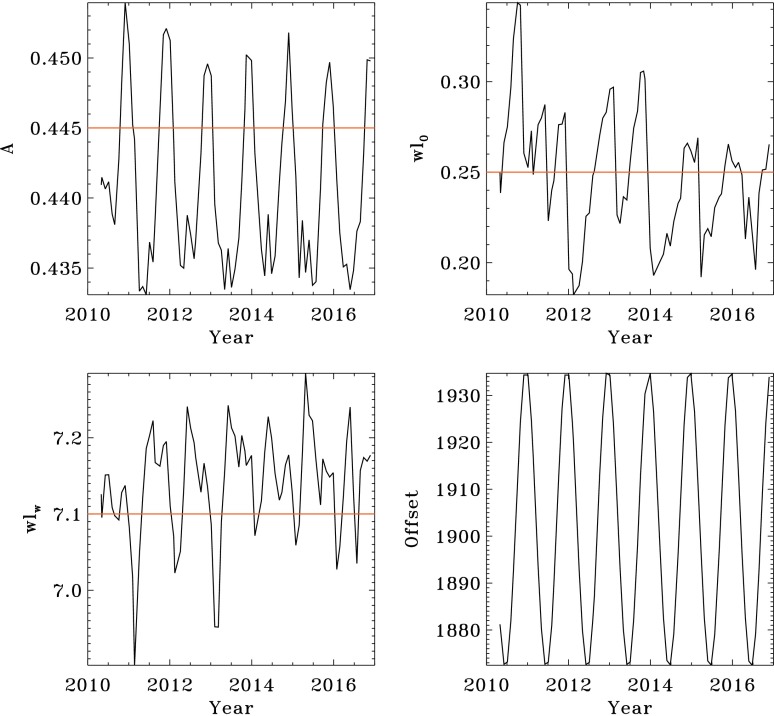
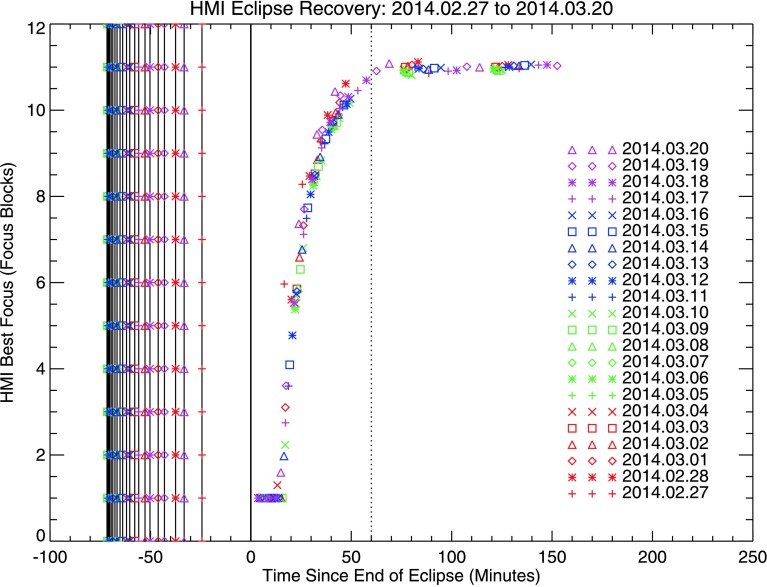
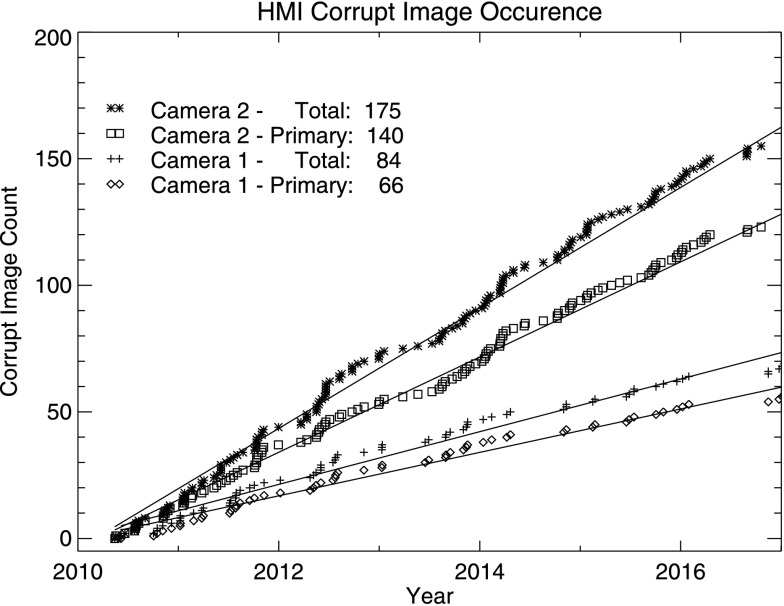
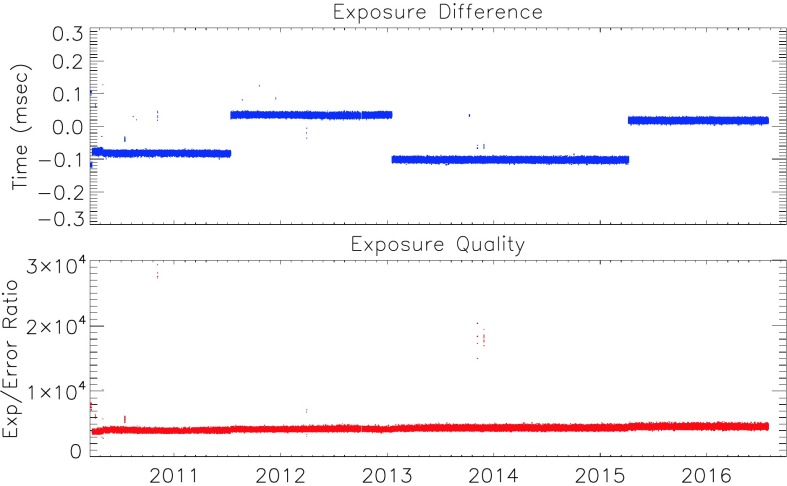
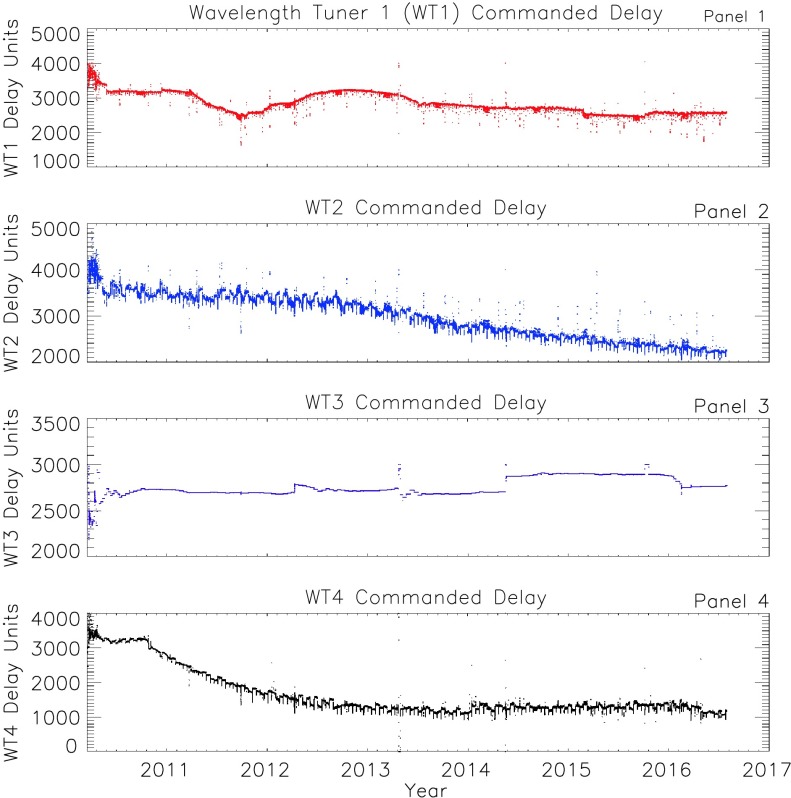
The Helioseismic and Magnetic Imager (HMI) instrument is a major component of NASA's Solar Dynamics Observatory (SDO) spacecraft. Since commencement of full regular science operations on 1 May 2010, HMI has operated with remarkable continuity, e.g. during the more than five years of the SDO prime mission that ended 30 September 2015, HMI collected 98.4% of all possible 45-second velocity maps; minimizing gaps in these full-disk Dopplergrams is crucial for helioseismology. HMI velocity, intensity, and magnetic-field measurements are used in numerous investigations, so understanding the quality of the data is important. This article describes the calibration measurements used to track the performance of the HMI instrument, and it details trends in important instrument parameters during the prime mission. Regular calibration sequences provide information used to improve and update the calibration of HMI data. The set-point temperature of the instrument front window and optical bench is adjusted regularly to maintain instrument focus, and changes in the temperature-control scheme have been made to improve stability in the observable quantities. The exposure time has been changed to compensate for a 20% decrease in instrument throughput. Measurements of the performance of the shutter and tuning mechanisms show that they are aging as expected and continue to perform according to specification. Parameters of the tunable optical-filter elements are regularly adjusted to account for drifts in the central wavelength. Frequent measurements of changing CCD-camera characteristics, such as gain and flat field, are used to calibrate the observations. Infrequent expected events such as eclipses, transits, and spacecraft off-points interrupt regular instrument operations and provide the opportunity to perform additional calibration. Onboard instrument anomalies are rare and seem to occur quite uniformly in time. The instrument continues to perform very well.

Keywords: Instrumental effects; Instrumentation and data management; Magnetic fields, photosphere; Velocity fields, photosphere.


Conflict of interest statement

The authors declare that they have no conflicts of interest.

Figures

Figure 1
Figure 1
HMI Dopplergram recovery during the mission. The daily percentage of all possible good-quality 45-second Dopplergrams recovered is plotted as a function of time from 1 May 2010 to 31 December 2016. On only 79 days were fewer than 90% of all possible Dopplergrams recovered, and only five days had less than 50% coverage.
Figure 2
Figure 2
Focus trend observed from the start of the prime mission on 1 May 2010 through the end of 2016 for the HMI front cameras (top), and the difference in best focus between the front and side cameras (bottom). The temperature of the front window is periodically adjusted to keep the focus near step 11.
Figure 3
Figure 3
HMI instrument subsystem temperatures from 1 March 2010 through 31 December 2016. The points are 30-minute averages of 8-second telemetry measurements sampled every three hours. The panels show the temperatures of the front door (top panel), front-window mounting ring (Panel 2), front-camera electronic box (CEB, Panel 3), front CCD (computed from 16-second telemetry), aft optical bench (Panel 5), and filter oven (bottom panel). Note the different temperature ranges, particularly for the tightly controlled filter oven and nearby optical bench. Annual variations and semi-annual eclipse-season perturbations are visible on the longer term. The first HMI processor reboot occurred on 20 April 2013. The thermal control scheme for elements of the optics package changed on 16 July 2013 and 25 February 2014. Daily differences between Noon and Midnight dominate the short-term variations. Systematic daily variations (see Figure 4) produce what look like multiple lines in the three-hour samples shown here.
Figure 4
Figure 4
HMI instrument subsystem temperatures for July 2015. Data are 30-minute averages and highlight the daily variations. Panels show temperatures for the front door (top), front-window mounting ring (Panel 2), CEB (3), front CCD (4), optical bench (5), and filter oven (bottom). The temperatures of the front door, CCD, and CEB are not actively controlled. The CCD radiators are oriented to see (mostly) dark, cold space. The temperature of the front-window mounting ring at the sensor (TS02) shown in Panel 2 remains constant during only part of the day. The door and electronics box show more complex daily patterns due to varying exposure to the Earth and other environmental factors.
Figure 5
Figure 5
Variation of the HMI plate scale (CDELT1) with time (top panel) compared to three different instrument temperatures. The solar radius has already been normalized to 1 AU using known geometric parameters. Camera 2 is shown in black, the slightly cooler Camera 1 is plotted in red. The second panel shows the temperature measured by a representative temperature sensor (TS37) in the HMI optics package. Panel 3 shows the temperature of the telescope tube. The bottom panel shows the front-window temperature. In each panel two values are shown for each day, one measured near the orbital perihelion, and the other near aphelion. These values roughly correspond to daily extremes in the instrument temperature.
Figure 6
Figure 6
Evolution of the end-to-end instrument throughput during the SDO mission. The average on-disk solar continuum intensity measured with Camera 1 (Camera 2) is plotted as a function of time in red (blue). The throughput of Camera 1 had decreased by slightly more than 20% by the end of 2016. The continuum intensity is measured during the twice-daily calibration sequences at about 06 UT and 18 UT. Symbols highlight 06 UT and 18 UT measurements approximately every 200 days for each camera. Short-term differences in a single camera primarily reflect temperature changes that are due to solar-irradiance and thermal-environment variations. Values, normalized to the intensity of the first image, have been corrected for the Sun–SDO distance and exposure time. Values have also been empirically adjusted to compensate for a permanent change in image crop radius on 28 January 2015.
Figure 7
Figure 7
Voltage variations of the image stabilization system (ISS) versus time. The HMI uses three PZTs to control the guiding mirror based on an error signal determined by limb sensors. The RMS of the voltage over an hour is an indication of the pointing jitter for which the system must compensate. The plot shows the RMS of the three one-hour-RMS values versus time. The SDO pointing was fairly stable until mid-2013, when the performance of one of three inertial reference units (IRU) started to deteriorate. A new mode using just two IRUs commenced in October 2013. The operating temperature of the IRU wheels was changed in September 2016, and the spacecraft pointing stability improved noticeably. For clarity, values outside the range 0.2 – 2.0 are omitted.
Figure 8
Figure 8
Wavelength drift of the HMI tunable elements determined during regularly scheduled detunes. The phase for each element has an arbitrary zero, and 360 corresponds to the full FSR of the element. The tuneable Lyot element (plusses) drifts slowly with time. The narrowband (NB) Michelson (asterisks) drifts only slightly more rapidly. The wideband Michelson (diamonds, offset in the plot by 140) has the largest drift, about an eighth of an FSR during the mission. A spacecraft anomaly on 2 August 2016 resulted in an extended loss of thermal control that had lasting effects, particularly on the Lyot filter phase. Symbols show the fit determined with images from Camera 2, and the connected solid lines show Camera 1; the difference is very small. A handful of anomalous fits are not shown.
Figure 9
Figure 9
Velocity drift of the HMI observable. The top panel shows the difference between the known Sun–SDO velocity and the median uncorrected velocity determined from an HMI Dopplergram. The drift in the measured velocity is due to the drift of the HMI filter elements. Breaks in the curve occur when the filter tuning is changed. The bottom panel shows the same, but without the velocity offset due to the retuning. A polynomial fit to the velocity drift is given, which indicates that the drift was initially slowing by −0.75 m s−1 per day.
Figure 10
Figure 10
Relative differences between a flat field from 23 January 2015 and one from 1 March 2010. Both flat fields are for Camera 2.
Figure 11
Figure 11
Daily mean and maximum number of bad pixels per image as a function of time for Camera 2.
Figure 12
Figure 12
Solar radius returned by the limb finder as a function of the effective wavelength at which the image is taken. Each of the six closed loops shows the radius determined for a particular tuning of the HMI wavelength filter system over the course of 17 May 2010, as the solar line shifts relative to HMI during the orbit. The hysteresis arises because of temperature changes in the instrument correlated with orbital position. The solid line is the Gaussian fit described in the text computed for this particular day.
Figure 13
Figure 13
Variation with time of the Gaussian-fit parameters that characterize the height-of-formation correction. The upper-left panel is the scaling factor [A]. The upper-right panel shows wl0; the lower-left is wlw; and the lower-right is the offset due to distance (not used in the correction). Eighty one-day fits are shown for the months from May 2010 through December 2016. The standard values are indicated by the horizontal red lines. See text for details.
Figure 14
Figure 14
HMI post-eclipse focus recovery during the Spring 2014 eclipse season.
Figure 15
Figure 15
Occurrence of corrupt images as a function of time for the two HMI cameras. The larger total for each camera counts both primary hits and the occasional corruption of the subsequent image.
Figure 16
Figure 16
Camera 2 exposure error and quality from 1 May 2010 – 31 July 2016. The top panel shows the difference between the commanded and measured exposure times for Camera 2. The bottom panel shows the ratio between the exposure time and the standard deviation in the measured exposure times. In each case the values shown are 45-second averages of 12 consecutive exposures that for display purposes are sampled every 12 minutes.
Figure 17
Figure 17
Commanded polarization-selector delay times in engineering delay units. Delay units are approximately microseconds. Values are averaged for 30 minutes.
Figure 18
Figure 18
Wavelength tuner delays in engineering delay units.

References

    1. Bobra M.G., Sun X., Hoeksema J.T., Turmon M., Liu Y., Hayashi K., Barnes G., Leka K.D. The Helioseismic and Magnetic Imager (HMI) vector magnetic field pipeline: SHARPs – space-weather HMI active region patches. Solar Phys. 2014;289:3549. doi: 10.1007/s11207-014-0529-3. - DOI
    1. Couvidat S., Rajaguru S.P., Wachter R., Sankarasubramanian K., Schou J., Scherrer P.H. Line-of-sight observables algorithms for the Helioseismic and Magnetic Imager (HMI) instrument tested with Interferometric Bidimensional Spectrometer (IBIS) observations. Solar Phys. 2012;278:217. doi: 10.1007/s11207-011-9927-y. - DOI
    1. Couvidat S., Schou J., Shine R.A., Bush R.I., Miles J.W., Scherrer P.H., Rairden R.L. Wavelength dependence of the Helioseismic and Magnetic Imager (HMI) Instrument onboard the Solar Dynamics Observatory (SDO) Solar Phys. 2012;275:285. doi: 10.1007/s11207-011-9723-8. - DOI - PMC - PubMed
    1. Couvidat S., Schou J., Hoeksema J.T., Bogart R.S., Bush R.I., Duvall T.L., Liu Y., Norton A.A., Scherrer P.H. Observables processing for the Helioseismic and Magnetic Imager Instrument on the Solar Dynamics Observatory. Solar Phys. 2016;291:1887. doi: 10.1007/s11207-016-0957-3. - DOI
    1. Emilio M., Couvidat S., Bush R.I., Kuhn J.R., Scholl I.F. Measuring the solar radius from space during the 2012 Venus transit. Astrophys. J. 2015;798:48. doi: 10.1088/0004-637X/798/1/48. - DOI

LinkOut - more resources