

Modelling the effect of spatially variable soil properties on the distribution of weeds
- PMID: 31007345
- PMCID: PMC6472614
- DOI: 10.1016/j.ecolmodel.2018.11.002
Modelling the effect of spatially variable soil properties on the distribution of weeds
Abstract
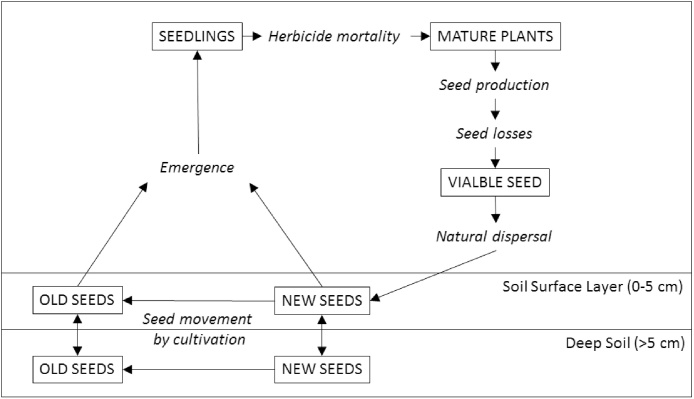
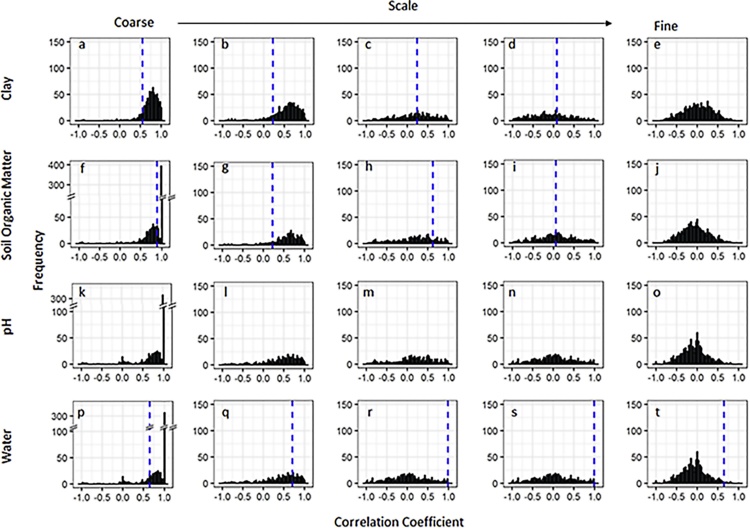
The patch spraying of weeds is an area of precision agriculture that has had limited uptake. This is in part due to the perceived risks associated with not controlling individual weeds. Nevertheless, the inherent patchiness of weeds makes them ideal targets for site-specific management. We propose using a mechanistic model to identify areas of a field vulnerable to invasion by weeds, allowing the creation of treatment maps that are risk averse. We developed a spatially-explicit mechanistic model of the life-cycle of Alopecurus myosuroides, a particularly problematic weed of cereal crops in the UK. In the model, soil conditions which vary across the field, affect the life-cycle of A. myosuroides. The model was validated using data on the within-field distribution of A. myosuroides on commercial farms and its co-location with soil properties. We demonstrate the important role played by soil properties in determining the within-field distribution of A. myosuroides. We also show that scale-dependent correlations between A. myosuroides and soil properties observed in the field are an emergent property of the modelled dynamics of the A. myosuroides life-cycle. Our model could therefore support effective site-specific management of A. myosuroides within fields by predicting areas that are vulnerable to A. myosuroides. The usefulness of this model in its ability to predict patch locations for A. myosuroides highlights the possibility of using similar models for other species where data are available on the response of the species to various soil properties.
Keywords: Alopecurus myosuroides; Life-cycle; Patch; Soil properties; Spatial model.
Figures

Similar articles
-
Designing a sampling scheme to reveal correlations between weeds and soil properties at multiple spatial scales.Weed Res. 2016 Feb;56(1):1-13. doi: 10.1111/wre.12184. Epub 2015 Nov 20. Weed Res. 2016. PMID: 26877560 Free PMC article.
-
Defining the habitat niche of Alopecurus myosuroides at the field scale.Weed Res. 2018 Jun;58(3):165-176. doi: 10.1111/wre.12300. Epub 2018 Mar 23. Weed Res. 2018. PMID: 29937595 Free PMC article.
-
The implications of spatially variable pre-emergence herbicide efficacy for weed management.Pest Manag Sci. 2018 Mar;74(3):755-765. doi: 10.1002/ps.4784. Epub 2017 Dec 14. Pest Manag Sci. 2018. PMID: 29095563 Free PMC article.
-
Global perspective of herbicide-resistant weeds.Pest Manag Sci. 2014 Sep;70(9):1306-15. doi: 10.1002/ps.3696. Epub 2014 Jan 15. Pest Manag Sci. 2014. PMID: 24302673 Review.
-
Paraquat and sustainable agriculture.Pest Manag Sci. 2004 Apr;60(4):340-9. doi: 10.1002/ps.823. Pest Manag Sci. 2004. PMID: 15119596 Review.
Cited by
-
Landscape Is the Main Driver of Weed Assemblages in Field Margins but Is Outperformed by Crop Competition in Field Cores.Plants (Basel). 2021 Oct 7;10(10):2131. doi: 10.3390/plants10102131. Plants (Basel). 2021. PMID: 34685940 Free PMC article.
References
-
- Allen R.G., Pereira L.S., Raes D., Smith M. FAO; Rome: 1998. Crop Evapotranspiration – Guidelines for Computing Crop Water Requirements – FAO Irrigation and Drainage Paper 56. 300 (9)
-
- Bayer CropScience, 2017. Atlantis WG – Don’t wait until March. Available at: http://cropscience.bayer.co.uk/our-products/herbicides/atlantis-wg/dont-... [Accessed 17 August 2017].
-
- Benvenuti S. Natural weed seed burial: effect of soil texture, rain and seed characteristics. Seed Sci. Res. 2007;17(3):211–219.
-
- Castaldi F., Pelosi F., Pascucci S., Casa R. Assessing the potential of images from unmanned aerial vehicles (UAV) to support herbicide patch spraying in maize. Precis. Agric. 2016;18(1):76–94.
-
- Christensen S., Søgaard H.T., Kudsk P., Norremark M., Lund I., Nadimi E.S., Jorgensen R. Site-specific weed control technologies. Weed Res. 2009;49:233–241.
LinkOut - more resources
Full Text Sources