

Varietal improvement options for higher rice productivity in salt affected areas using crop modelling
- PMID: 31007364
- PMCID: PMC6472128
- DOI: 10.1016/j.fcr.2018.08.020
Varietal improvement options for higher rice productivity in salt affected areas using crop modelling
Abstract
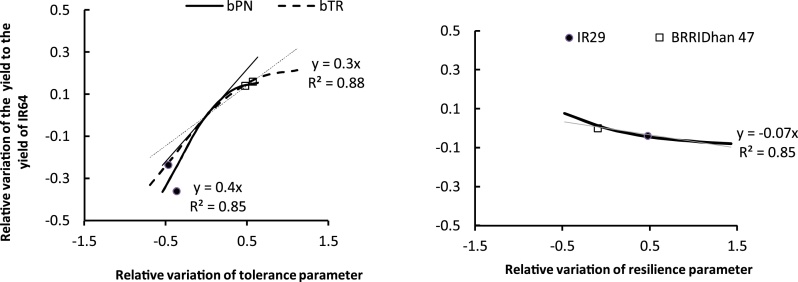
The rice model ORYZA v3 has been recently improved to account for salt stress effect on rice crop growth and yield. This paper details subsequent studies using the improved model to explore opportunities for improving salinity tolerance in rice. The objective was to identify combinations of plant traits influencing rice responses to salinity and to quantify yield gains by improving these traits. The ORYZA v3 model was calibrated and validated with field experimental data collected between 2012 and 2014 in Satkhira, Bangladesh and Infanta, Quezon, Philippines, then used for simulations scenario considering virtual varieties possessing different combinations of crop model parameter values related to crop salinity response and the soil salinity dynamic observed at Satkhira site. Simulation results showed that (i) short duration varieties could escape end of season increase in salinity, while long duration varieties could benefit from an irrigated desalinization period occurring during the later stages of crop growth in the Satkhira situation; (ii) combining short duration growth with salt tolerance (bTR and bPN) above 12 dS m-1 and a resilience trait (aSalt) of 0.11 in a variety, allows maintenance of 65-70% of rice yield under increasing salinity levels of up to 16 dS m-1; and (iii) increasing the value of the tolerance parameter b by 1% results in 0.3-0.4% increase in yield. These results are relevant for defining directions to increase rice productivity in saline environments, based on improvements in phenology and quantifiable salt tolerance traits.
Keywords: Cropping systems; Genotype; Modelling; ORYZA v3; Trait selection; Water availability.
Figures

References
-
- Ahmed S., Humphreys E., Salim M., Chauhan B.S. Optimizing sowing management for short duration dry seeded aman rice on the High Ganges River floodplain of Bangladesh. Field Crops Res. 2014;169:77–88.
-
- Asch F., Dingkuhn M., Wittstock C., Dörffling K. Sodium and Potassium Uptake of Rice Panicles as Affected by Salinity and Season in Relation to Yield and Yield Components. Plant Soil. 1999;207:133–145.
-
- Balwinder-Singh, Humphreys E., Sudhir-Yadav, Gaydon D.S. Options for increasing the productivity of the rice-wheat system of north-west India while reducing groundwater depletion. Part 1. Rice variety duration, sowing date and inclusion of mungbean. Field Crops Res. 2015;173:68–80.
-
- Bannayan M., Kobayashi K., Kim H.Y., Lieffering M., Okada M., Miura S. Modeling the interactive effects of atmospheric CO2 and N on rice growth and yield. Field Crops Res. 2005;93:237–251.
-
- Belder P., Bouman B.A.M., Spiertz J.H.J., Lu G. Comparing options for water savings in lowland rice using a modeling approach. Agric. Syst. 2007;92:91–114.
LinkOut - more resources
Full Text Sources