

Cancer Genetic Network Inference Using Gaussian Graphical Models
- PMID: 31007526
- PMCID: PMC6456846
- DOI: 10.1177/1177932219839402
Cancer Genetic Network Inference Using Gaussian Graphical Models
Abstract
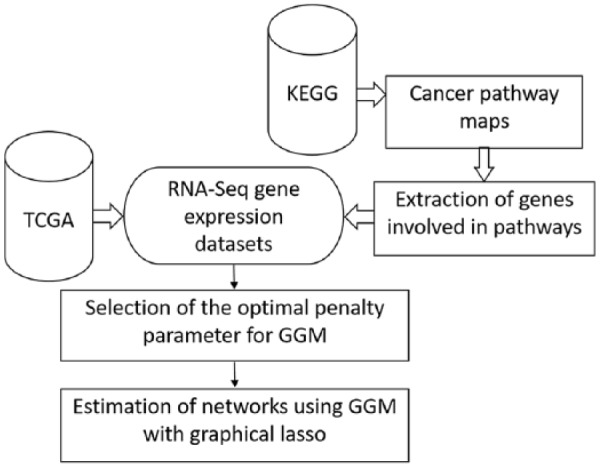
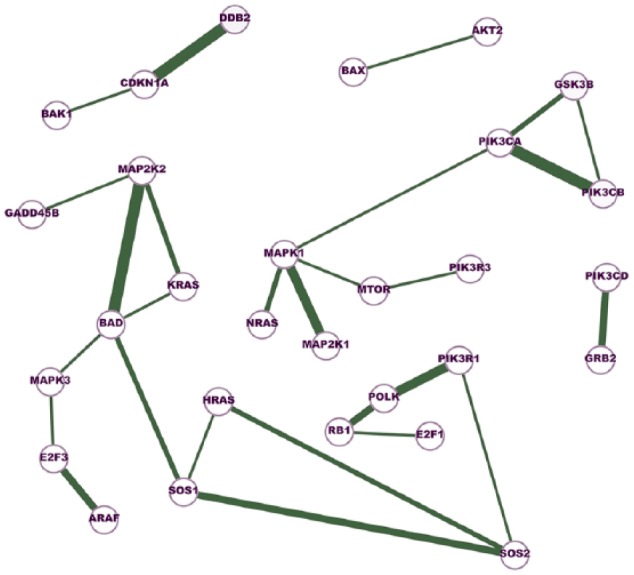
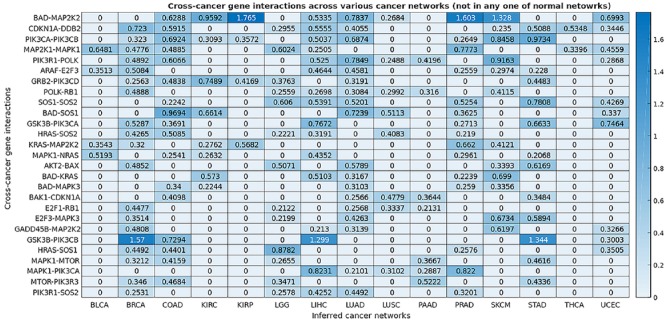
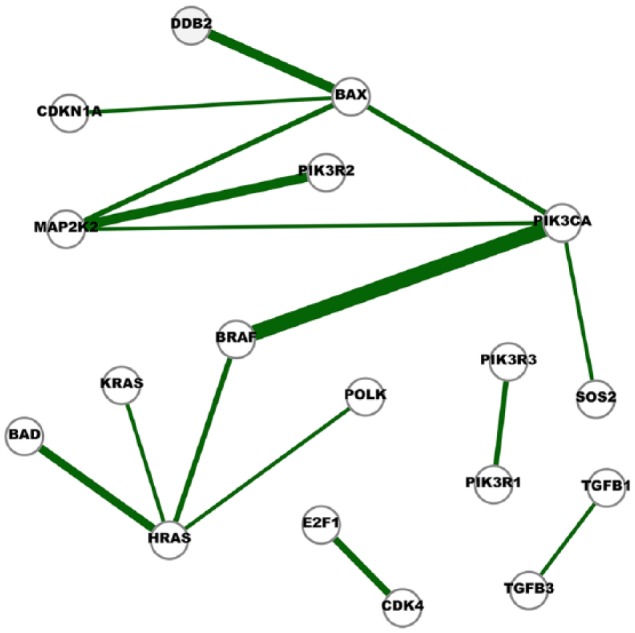
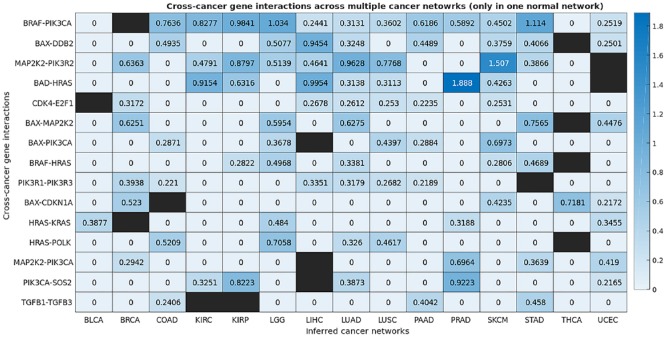
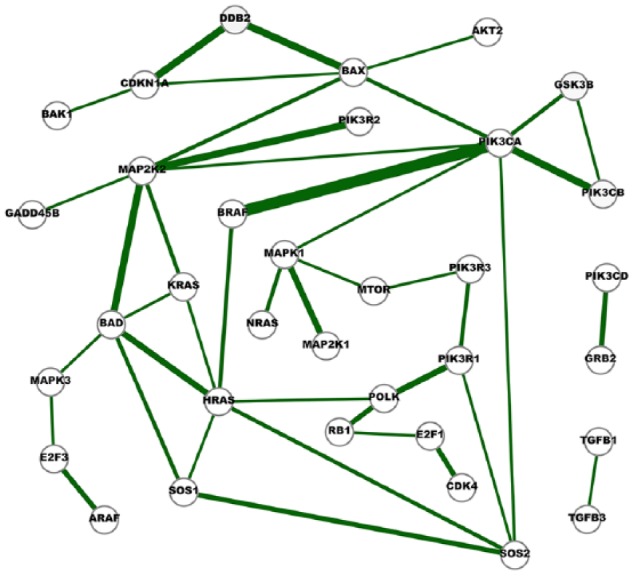
The Cancer Genome Atlas (TCGA) provides a rich resource that can be used to understand how genes interact in cancer cells and has collected RNA-Seq gene expression data for many types of human cancer. However, mining the data to uncover the hidden gene-interaction patterns remains a challenge. Gaussian graphical model (GGM) is often used to learn genetic networks because it defines an undirected graphical structure, revealing the conditional dependences of genes. In this study, we focus on inferring gene interactions in 15 specific types of human cancer using RNA-Seq expression data and GGM with graphical lasso. We take advantage of the corresponding Kyoto Encyclopedia of Genes and Genomes pathway maps to define the subsets of related genes. RNA-Seq expression levels of the subsets of genes in solid cancerous tumor and normal tissues were extracted from TCGA. The gene expression data sets were cleaned and formatted, and the genetic network corresponding to each cancer type was then inferred using GGM with graphical lasso. The inferred networks reveal stable conditional dependences among the genes at the expression level and confirm the essential roles played by the genes that encode proteins involved in the two key signaling pathway phosphoinositide 3-kinase (PI3K)/AKT/mTOR and Ras/Raf/MEK/ERK in human carcinogenesis. These stable dependences elucidate the expression level interactions among the genes that are implicated in many different human cancers. The inferred genetic networks were examined to further identify and characterize a collection of gene interactions that are unique to cancer. The cross-cancer genetic interactions revealed from our study provide another set of knowledge for cancer biologists to propose strong hypotheses, so further biological investigations can be conducted effectively.
Keywords: Computational biology; machine learning; network meta-analysis.
Conflict of interest statement
Declaration of conflicting interests:The author(s) declared no potential conflicts of interest with respect to the research, authorship, and/or publication of this article.
Figures
Similar articles
-
An Integrated Approach of Learning Genetic Networks From Genome-Wide Gene Expression Data Using Gaussian Graphical Model and Monte Carlo Method.Bioinform Biol Insights. 2023 Feb 27;17:11779322231152972. doi: 10.1177/11779322231152972. eCollection 2023. Bioinform Biol Insights. 2023. PMID: 36865982 Free PMC article.
-
Incorporating prior biological knowledge for network-based differential gene expression analysis using differentially weighted graphical LASSO.BMC Bioinformatics. 2017 Feb 10;18(1):99. doi: 10.1186/s12859-017-1515-1. BMC Bioinformatics. 2017. PMID: 28187708 Free PMC article.
-
A Multiattribute Gaussian Graphical Model for Inferring Multiscale Regulatory Networks: An Application in Breast Cancer.Methods Mol Biol. 2019;1883:143-160. doi: 10.1007/978-1-4939-8882-2_6. Methods Mol Biol. 2019. PMID: 30547399
-
An Augmented High-Dimensional Graphical Lasso Method to Incorporate Prior Biological Knowledge for Global Network Learning.Front Genet. 2022 Jan 27;12:760299. doi: 10.3389/fgene.2021.760299. eCollection 2021. Front Genet. 2022. PMID: 35154240 Free PMC article.
-
Pathway Graphical Lasso.Proc AAAI Conf Artif Intell. 2015 Jan;2015:2617-2623. Proc AAAI Conf Artif Intell. 2015. PMID: 26167394 Free PMC article.
Cited by
-
Inferring cancer common and specific gene networks via multi-layer joint graphical model.Comput Struct Biotechnol J. 2023 Jan 18;21:974-990. doi: 10.1016/j.csbj.2023.01.017. eCollection 2023. Comput Struct Biotechnol J. 2023. PMID: 36733706 Free PMC article.
-
scLink: Inferring Sparse Gene Co-expression Networks from Single-cell Expression Data.Genomics Proteomics Bioinformatics. 2021 Jun;19(3):475-492. doi: 10.1016/j.gpb.2020.11.006. Epub 2021 Jul 10. Genomics Proteomics Bioinformatics. 2021. PMID: 34252628 Free PMC article.
-
Algal origins of core land plant stress response subnetworks.Plant J. 2025 Jun;122(6):e70291. doi: 10.1111/tpj.70291. Plant J. 2025. PMID: 40550109 Free PMC article.
-
sPGGM: a sample-perturbed Gaussian graphical model for identifying pre-disease stages and signaling molecules of disease progression.Natl Sci Rev. 2025 May 14;12(8):nwaf189. doi: 10.1093/nsr/nwaf189. eCollection 2025 Aug. Natl Sci Rev. 2025. PMID: 40635685 Free PMC article.
-
HARMONIES: A Hybrid Approach for Microbiome Networks Inference via Exploiting Sparsity.Front Genet. 2020 Jun 3;11:445. doi: 10.3389/fgene.2020.00445. eCollection 2020. Front Genet. 2020. PMID: 32582274 Free PMC article.
References
-
- Garraway L, Lander E. Lessons from the cancer genome. Cell. 2013;153:17–37. - PubMed
LinkOut - more resources
Full Text Sources
Research Materials
Miscellaneous
