

Anti-Atopic Dermatitis Effect of Seaweed Fulvescens Extract via Inhibiting the STAT1 Pathway
- PMID: 31007602
- PMCID: PMC6441517
- DOI: 10.1155/2019/3760934
Anti-Atopic Dermatitis Effect of Seaweed Fulvescens Extract via Inhibiting the STAT1 Pathway
Abstract
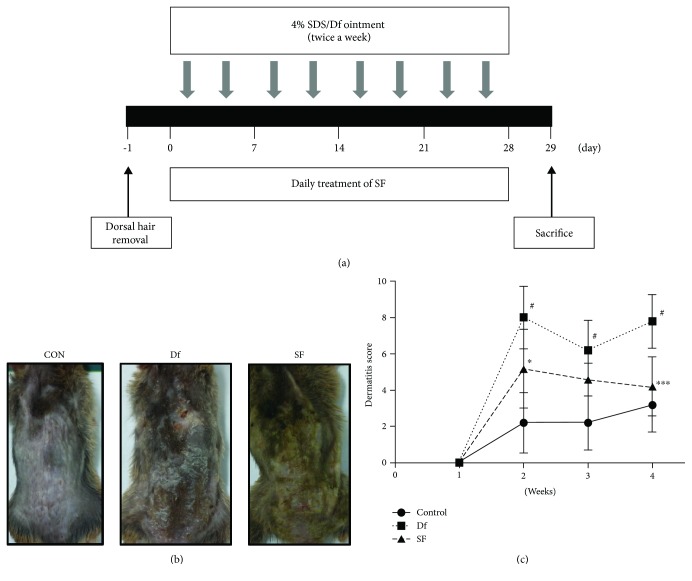
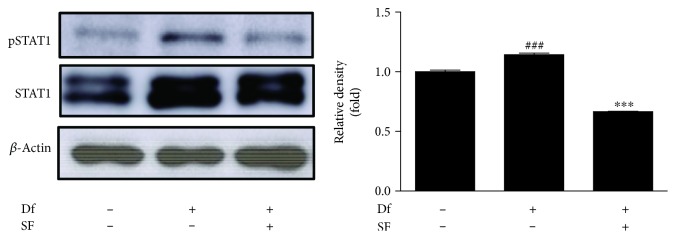
Seaweed fulvescens (SF) is a green alga rich in chlorophyll with unique flavor and taste. It is also called Maesaengi which has antioxidant and other physiological activities. In the present study, we evaluated the therapeutic effects of SF in a mouse model of Dermatophagoides farinae body-induced atopic dermatitis (AD) and in tumor necrosis factor-α and interferon-γ-stimulated HaCaT keratinocytes. SF treatment (200 mg/mouse) inhibited the development of AD symptoms, compared to that in the control group, as evidenced from the improved dorsal skin lesion, reduced thickness and infiltration of inflammatory cells and smaller lymph nodes, and reduced levels of proinflammatory cytokines. In HaCaT keratinocytes, SF (10, 25, and 50 μg/mL) suppressed the production of proinflammatory cytokines in a dose-dependent manner. In addition, SF reduced the phosphorylation of signal transducer and activator of transcription 1, which is one of the major signaling molecules involved in cellular inflammation. These results suggested that SF could be a potential therapeutic alternative for the treatment of AD.
Figures


Similar articles
-
Ethanolic Extracts of Artemisia apiacea Hance Improved Atopic Dermatitis-Like Skin Lesions In Vivo and Suppressed TNF-Alpha/IFN-Gamma⁻Induced Proinflammatory Chemokine Production In Vitro.Nutrients. 2018 Jun 22;10(7):806. doi: 10.3390/nu10070806. Nutrients. 2018. PMID: 29932162 Free PMC article.
-
Inhibitory Effects of Helianthus tuberosus Ethanol Extract on Dermatophagoides farina body-induced Atopic Dermatitis Mouse Model and Human Keratinocytes.Nutrients. 2018 Nov 3;10(11):1657. doi: 10.3390/nu10111657. Nutrients. 2018. PMID: 30400334 Free PMC article.
-
Jageum-Jung improves 2,4-dinitrochlorobenzene-induced atopic dermatitis-like skin lesions in mice and suppresses pro-inflammatory chemokine production by inhibiting TNF-α/IFN-γ-induced STAT-1 and NFκB signaling in HaCaT cells.J Ethnopharmacol. 2018 Jul 15;221:48-55. doi: 10.1016/j.jep.2018.04.016. Epub 2018 Apr 14. J Ethnopharmacol. 2018. PMID: 29660465
-
Laminaria japonica Suppresses the Atopic Dermatitis-Like Responses in NC/Nga Mice and Inflamed HaCaT Keratinocytes via the Downregulation of STAT1.Nutrients. 2020 Oct 23;12(11):3238. doi: 10.3390/nu12113238. Nutrients. 2020. PMID: 33113891 Free PMC article.
-
Modulatory effects of selenium and strontium salts on keratinocyte-derived inflammatory cytokines.Arch Dermatol Res. 1995;287(7):680-2. doi: 10.1007/BF00371742. Arch Dermatol Res. 1995. PMID: 8534133 Review. No abstract available.
Cited by
-
Macrocystis pyrifera Lipids Reduce Cytokine-Induced Pro-Inflammatory Signalling and Barrier Dysfunction in Human Keratinocyte Models.Int J Mol Sci. 2023 Nov 16;24(22):16383. doi: 10.3390/ijms242216383. Int J Mol Sci. 2023. PMID: 38003573 Free PMC article.
-
Polyopes affinis Suppressed IFN-γ- and TNF-α-Induced Inflammation in Human Keratinocytes via Down-Regulation of the NF-κB and STAT1 Pathways.Molecules. 2022 Mar 11;27(6):1836. doi: 10.3390/molecules27061836. Molecules. 2022. PMID: 35335198 Free PMC article.
-
Revealing the Potential of Fucus vesiculosus Linnaeus for Cosmetic Purposes: Chemical Profile and Biological Activities of Commercial and Wild Samples.Mar Drugs. 2024 Dec 4;22(12):548. doi: 10.3390/md22120548. Mar Drugs. 2024. PMID: 39728123 Free PMC article.
-
The Beneficial Roles of Seaweed in Atopic Dermatitis.Mar Drugs. 2024 Dec 17;22(12):566. doi: 10.3390/md22120566. Mar Drugs. 2024. PMID: 39728140 Free PMC article. Review.
-
Anti-Inflammatory and Antiatopic Effects of Rorippa cantoniensis (Lour.) Ohwi in RAW 264.7 and HaCaT Cells.Molecules. 2023 Jul 17;28(14):5463. doi: 10.3390/molecules28145463. Molecules. 2023. PMID: 37513335 Free PMC article.
References
-
- Choi E. J., Debnath T., Tang Y., Ryu Y. B., Moon S. H., Kim E. K. Topical application of Moringa oleifera leaf extract ameliorates experimentally induced atopic dermatitis by the regulation of Th1/Th2/Th17 balance. Biomedicine & Pharmacotherapy. 2016;84:870–877. doi: 10.1016/j.biopha.2016.09.085. - DOI - PubMed
-
- Lee K. S., Chun S. Y., Lee M. G., Kim S., Jang T. J., Nam K. S. The prevention of TNF-α/IFN-γ mixture-induced inflammation in human keratinocyte and atopic dermatitis-like skin lesions in Nc/Nga mice by mineral-balanced deep sea water. Biomedicine & Pharmacotherapy. 2018;97:1331–1340. doi: 10.1016/j.biopha.2017.11.056. - DOI - PubMed
MeSH terms
Substances
LinkOut - more resources
Full Text Sources
Research Materials
Miscellaneous
