. 2019 Jan;28(2):78-95.
doi: 10.1111/geb.12783. Epub 2018 Nov 16.

Traditional plant functional groups explain variation in economic but not size-related traits across the tundra biome

H J D Thomas  1 I H Myers-Smith  1 A D Bjorkman  1   2   3 S C Elmendorf  4 D Blok  5 J H C Cornelissen  6 B C Forbes  7 R D Hollister  8 S Normand  2 J S Prevéy  9 C Rixen  9 G Schaepman-Strub  10 M Wilmking  11 S Wipf  9 W K Cornwell  12 J Kattge  13   14 S J Goetz  15 K C Guay  16 J M Alatalo  17 A Anadon-Rosell  11   18   19 S Angers-Blondin  1 L T Berner  15 R G Björk  20   21 A Buchwal  22   23 A Buras  24 M Carbognani  25 K Christie  26 L Siegwart Collier  27 E J Cooper  28 A Eskelinen  14   29   30 E R Frei  31 O Grau  32 P Grogan  33 M Hallinger  34 M M P D Heijmans  35 L Hermanutz  27 J M G Hudson  36 K Hülber  37 M Iturrate-Garcia  10 C M Iversen  38 F Jaroszynska  39 J F Johnstone  40 E Kaarlejärvi  41   42   43 A Kulonen  9   39 L J Lamarque  44 E Lévesque  44 C J Little  10   45 A Michelsen  46   47 A Milbau  48 J Nabe-Nielsen  2 S S Nielsen  2 J M Ninot  18   19 S F Oberbauer  49 J Olofsson  41 V G Onipchenko  50 A Petraglia  25 S B Rumpf  37 P R Semenchuk  28   37 N A Soudzilovskaia  51 M J Spasojevic  52 J D M Speed  53 K D Tape  54 M Te Beest  41   55 M Tomaselli  25 A Trant  27   56 U A Treier  2 S Venn  57   58 T Vowles  20 S Weijers  59 T Zamin  33 O K Atkin  57 M Bahn  60 B Blonder  61   62 G Campetella  63 B E L Cerabolini  64 F S Chapin Iii  65 M Dainese  66 F T de Vries  67 S Díaz  68 W Green  69 R B Jackson  70 P Manning  3 Ü Niinemets  71 W A Ozinga  35 J Peñuelas  32   72 P B Reich  73   74 B Schamp  75 S Sheremetev  76 P M van Bodegom  51
Affiliations

Traditional plant functional groups explain variation in economic but not size-related traits across the tundra biome

H J D Thomas et al. Glob Ecol Biogeogr. 2019 Jan.

Abstract

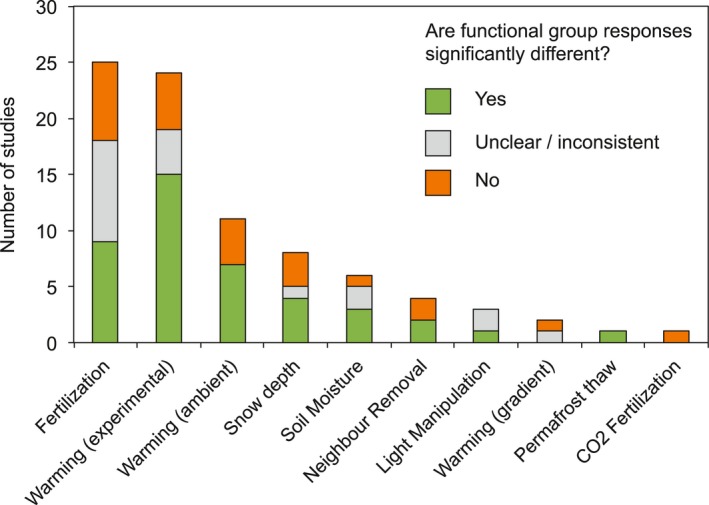
Aim: Plant functional groups are widely used in community ecology and earth system modelling to describe trait variation within and across plant communities. However, this approach rests on the assumption that functional groups explain a large proportion of trait variation among species. We test whether four commonly used plant functional groups represent variation in six ecologically important plant traits.

Location: Tundra biome.

Time period: Data collected between 1964 and 2016.

Major taxa studied: 295 tundra vascular plant species.

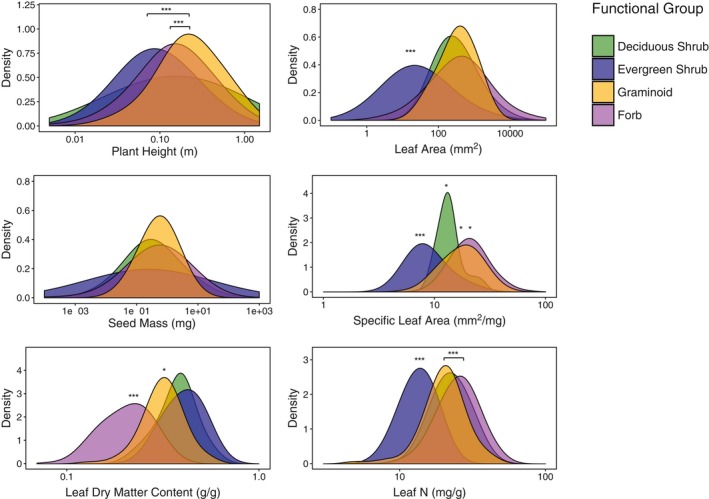
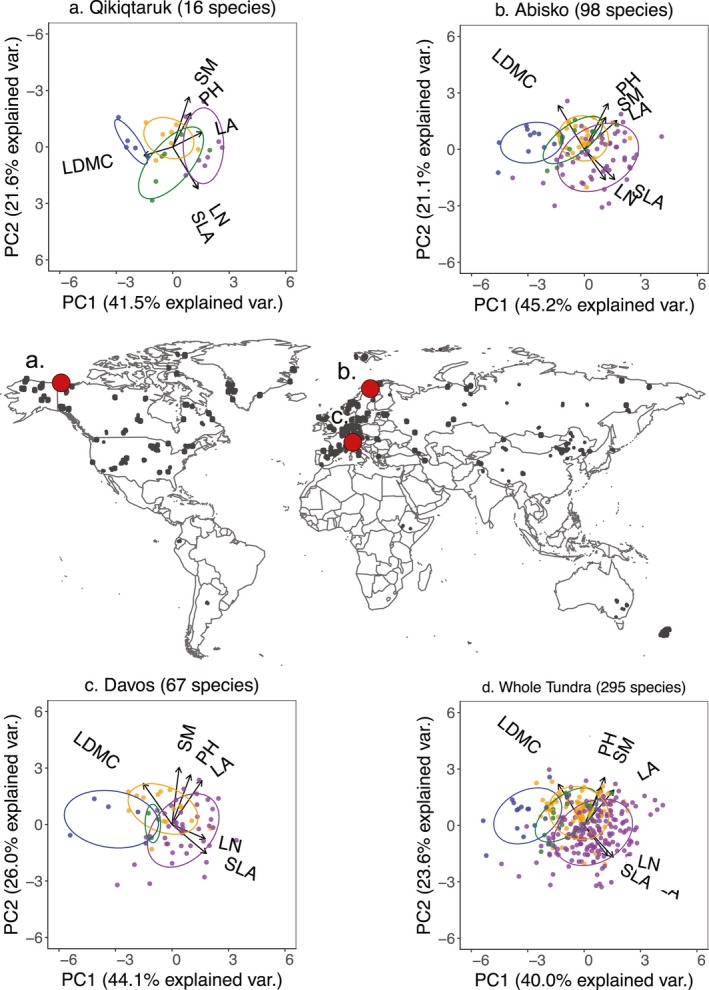
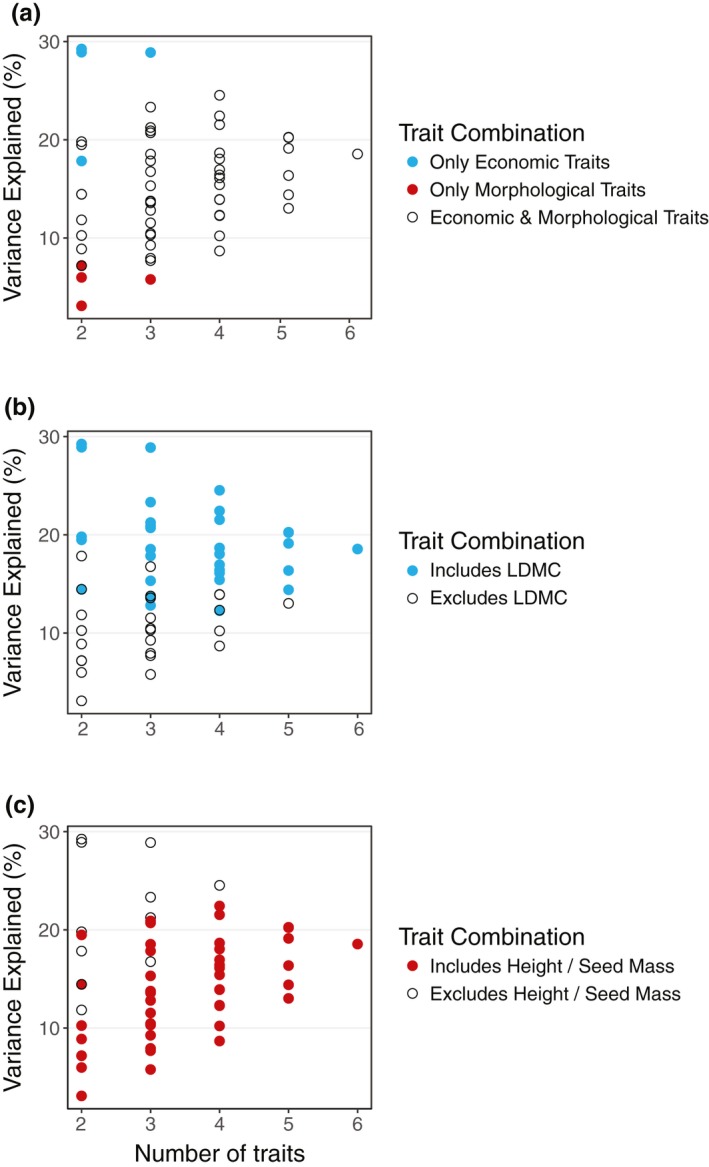
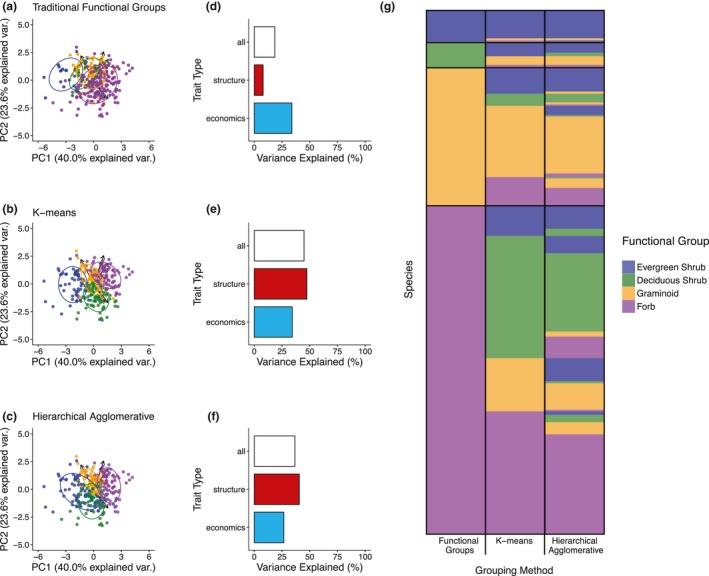
Methods: We compiled a database of six plant traits (plant height, leaf area, specific leaf area, leaf dry matter content, leaf nitrogen, seed mass) for tundra species. We examined the variation in species-level trait expression explained by four traditional functional groups (evergreen shrubs, deciduous shrubs, graminoids, forbs), and whether variation explained was dependent upon the traits included in analysis. We further compared the explanatory power and species composition of functional groups to alternative classifications generated using post hoc clustering of species-level traits.

Results: Traditional functional groups explained significant differences in trait expression, particularly amongst traits associated with resource economics, which were consistent across sites and at the biome scale. However, functional groups explained 19% of overall trait variation and poorly represented differences in traits associated with plant size. Post hoc classification of species did not correspond well with traditional functional groups, and explained twice as much variation in species-level trait expression.

Main conclusions: Traditional functional groups only coarsely represent variation in well-measured traits within tundra plant communities, and better explain resource economic traits than size-related traits. We recommend caution when using functional group approaches to predict tundra vegetation change, or ecosystem functions relating to plant size, such as albedo or carbon storage. We argue that alternative classifications or direct use of specific plant traits could provide new insights for ecological prediction and modelling.

Keywords: cluster analysis; community composition; ecosystem function; plant functional groups; plant functional types; plant traits; tundra biome; vegetation change.


Figures

Figure 1
Figure 1
Studies employing an “evergreen shrub ‐ deciduous shrub ‐ graminoid – forb” functional group classification (or close variant) to examine the response of tundra communities to environmental change over the past two decades. Studies were identified based on a literature search on Web of Science using the search terms “tundra" and “plant functional group” or “plant functional type”. For a list of studies see Appendix A. Studies are grouped by whether they found clear differences in functional group response (Yes: clear differences were found between some (but not necessarily all) functional groups; Not clear: differences between groups were inconsistent amongst sites or over time; No: No significant differences in functional group response). Studies vary in duration from 2–30 years and incorporate a range of bioclimatic contexts and experimental types. For full meta‐analyses of functional group response see Dormann and Woodin (2002) and Dorrepaal (2007)
Figure 2
Figure 2
Smoothed distribution of species‐level traits represented by the four traditional tundra plant functional groups. Distributions are based on species‐level mean traits for the 295 tundra species for which data are available for all six plant traits of interest. Trait values are presented on the x axis in untransformed units on a log scale. Significance of distributions is indicated by symbols (pairwise Wilcoxon rank sum test; * = p < 0.05; ** = p < 0.01, *** = p < 0.001). Pairs of traits that are significantly different from each other, but not different from other functional groups, are indicated by black bars connecting the centre of those two distributions
Figure 3
Figure 3
Distribution of tundra species in trait space. Inset plots indicate principal components analysis (PCA) multivariate distribution of six plant traits for three tundra sites, (a) Qikiqtaruk, (b) Abisko (c) Davos, and for (d) the whole tundra biome. Trait space was defined based on plant height (PH), seed mass (SM), leaf area (LA), specific leaf area (SLA), leaf dry matter content (LDMC) and leaf nitrogen content (LN). Individual species are represented by points and functional groups by point colour (blue = evergreen shrub, green = deciduous shrub, yellow = graminoid, purple = forb). Ellipses represent 95% confidence interval of functional group distributions. Arrows indicate direction and weighting of each trait. Georeferenced trait collection locations are indicated on the map by grey circles and modelled site locations by red circles
Figure 4
Figure 4
Trait variation explained by functional groups for all possible trait combinations. Functional groups best explained combinations of (a) only economic traits, or (b) those containing leaf dry matter content (LDMC), and worst explained combinations of only morphological traits or (c) those containing plant height or seed mass. Points indicate the mean variance explained (PERMANOVA R 2) by functional groups and coloured to visualize the importance of different trait combinations
Figure 5
Figure 5
Comparison of group structure, trait variation explained, and group composition between traditional functional groups and post hoc classifications. (a–c) principal components analysis (PCA) visualization of species clusters as defined by (a) traditional functional groups, (b) k‐means clustering, and (c) hierarchical‐agglomerative clustering (HCA). Species are indicated by points and group distribution by ellipses. Colours indicate groups (dark blue = evergreen shrub, green = deciduous shrub, yellow = graminoid, purple = forb). Post hoc classifications are matched with functional groups based on maximum species correspondence between grouping methods, such that each post hoc classification corresponds with a traditional functional group. Post hoc groups approximately represent (i) tall species with large leaves and seeds (purple), (ii) mid‐sized species with economically acquisitive strategies (yellow), (iii) small species with economically acquisitive strategies (green) and (iv) small species with economically conservative strategies (blue). (d–f) Trait variation explained by (d) traditional functional groups, (e) k‐means, and (f) hierarchical agglomerative clustering (HCA) for multivariate combinations of all six plant traits (white), size‐related traits only (red) and economic traits only (light blue). (g) Comparison of group composition across clustering methods. The stacked bars represent individual species and are ordered by traditional functional group (species order remains consistent across columns). The colour of each stacked bar represents the group to which species were assigned by each classification method (classification can change across columns). For example, a species categorized as a graminoid by traditional functional groups can be categorized in the group most corresponding to forbs by post hoc classifications
Figure 6
Figure 6
Functional groups and post hoc trait‐based classifications capture different characteristics of tundra plant communities. Solid circles enclose characteristics represented by functional groups, post hoc classifications, and by both approaches, according to the findings of this study. The dotted circle encloses the data gaps for traits that are not well represented in tundra trait databases or trait‐based analysis yet are suggested to be important in the literature (Bardgett, Mommer, & Vries, 2014; Chave et al., 2009; Cleland et al., 2012; Eckstein et al., 1999)

Similar articles

  • Global plant trait relationships extend to the climatic extremes of the tundra biome.
    Thomas HJD, Bjorkman AD, Myers-Smith IH, Elmendorf SC, Kattge J, Diaz S, Vellend M, Blok D, Cornelissen JHC, Forbes BC, Henry GHR, Hollister RD, Normand S, Prevéy JS, Rixen C, Schaepman-Strub G, Wilmking M, Wipf S, Cornwell WK, Beck PSA, Georges D, Goetz SJ, Guay KC, Rüger N, Soudzilovskaia NA, Spasojevic MJ, Alatalo JM, Alexander HD, Anadon-Rosell A, Angers-Blondin S, Te Beest M, Berner LT, Björk RG, Buchwal A, Buras A, Carbognani M, Christie KS, Collier LS, Cooper EJ, Elberling B, Eskelinen A, Frei ER, Grau O, Grogan P, Hallinger M, Heijmans MMPD, Hermanutz L, Hudson JMG, Johnstone JF, Hülber K, Iturrate-Garcia M, Iversen CM, Jaroszynska F, Kaarlejarvi E, Kulonen A, Lamarque LJ, Lantz TC, Lévesque E, Little CJ, Michelsen A, Milbau A, Nabe-Nielsen J, Nielsen SS, Ninot JM, Oberbauer SF, Olofsson J, Onipchenko VG, Petraglia A, Rumpf SB, Shetti R, Speed JDM, Suding KN, Tape KD, Tomaselli M, Trant AJ, Treier UA, Tremblay M, Venn SE, Vowles T, Weijers S, Wookey PA, Zamin TJ, Bahn M, Blonder B, van Bodegom PM, Bond-Lamberty B, Campetella G, Cerabolini BEL, Chapin FS 3rd, Craine JM, Dainese M, Green WA, Jansen S, Kleyer M, Manning P, Niinemets Ü, Onoda Y, Ozinga WA, Peñuelas J, Poschlod… See abstract for full author list ➔ Thomas HJD, et al. Nat Commun. 2020 Mar 12;11(1):1351. doi: 10.1038/s41467-020-15014-4. Nat Commun. 2020. PMID: 32165619 Free PMC article.
  • Plant traits poorly predict winner and loser shrub species in a warming tundra biome.
    García Criado M, Myers-Smith IH, Bjorkman AD, Normand S, Blach-Overgaard A, Thomas HJD, Eskelinen A, Happonen K, Alatalo JM, Anadon-Rosell A, Aubin I, Te Beest M, Betway-May KR, Blok D, Buras A, Cerabolini BEL, Christie K, Cornelissen JHC, Forbes BC, Frei ER, Grogan P, Hermanutz L, Hollister RD, Hudson J, Iturrate-Garcia M, Kaarlejärvi E, Kleyer M, Lamarque LJ, Lembrechts JJ, Lévesque E, Luoto M, Macek P, May JL, Prevéy JS, Schaepman-Strub G, Sheremetiev SN, Siegwart Collier L, Soudzilovskaia NA, Trant A, Venn SE, Virkkala AM. García Criado M, et al. Nat Commun. 2023 Jun 28;14(1):3837. doi: 10.1038/s41467-023-39573-4. Nat Commun. 2023. PMID: 37380662 Free PMC article.
  • Plant traits inform predictions of tundra responses to global change.
    Myers-Smith IH, Thomas HJD, Bjorkman AD. Myers-Smith IH, et al. New Phytol. 2019 Mar;221(4):1742-1748. doi: 10.1111/nph.15592. Epub 2018 Dec 24. New Phytol. 2019. PMID: 30444539 Review.
  • Snow is an important control of plant community functional composition in oroarctic tundra.
    Happonen K, Aalto J, Kemppinen J, Niittynen P, Virkkala AM, Luoto M. Happonen K, et al. Oecologia. 2019 Nov;191(3):601-608. doi: 10.1007/s00442-019-04508-8. Epub 2019 Sep 14. Oecologia. 2019. PMID: 31522244 Free PMC article.
  • Revisiting the Holy Grail: using plant functional traits to understand ecological processes.
    Funk JL, Larson JE, Ames GM, Butterfield BJ, Cavender-Bares J, Firn J, Laughlin DC, Sutton-Grier AE, Williams L, Wright J. Funk JL, et al. Biol Rev Camb Philos Soc. 2017 May;92(2):1156-1173. doi: 10.1111/brv.12275. Epub 2016 Apr 22. Biol Rev Camb Philos Soc. 2017. PMID: 27103505 Review.

Cited by

  • Geographic Origin and Functional Group Type Affect the Decomposability of Peatland Plant Litter Through Biochemical Properties.
    Ma J, Chen YD, Wang SN, Zeng J, Liu C, Bu ZJ. Ma J, et al. Ecol Evol. 2025 Jul 7;15(7):e71758. doi: 10.1002/ece3.71758. eCollection 2025 Jul. Ecol Evol. 2025. PMID: 40625328 Free PMC article.
  • Concurrent anthropogenic stressors affect plant-soil systems with different plant diversity levels.
    Zhu Y, Meidl P, Li H, Bi M, Ryo M, Rillig MC. Zhu Y, et al. New Phytol. 2025 Aug;247(4):1897-1911. doi: 10.1111/nph.70275. Epub 2025 Jun 4. New Phytol. 2025. PMID: 40468774 Free PMC article.
  • Climate Change Dependence in Ex Situ Conservation of Wild Medicinal Plants in Crete, Greece.
    Bariotakis M, Georgescu L, Laina D, Koufaki M, Souma M, Douklias S, Giannakakis KA, Chouli KN, Paoli L, Loppi S, Karousou R, Smykal P, Castanas E, Pirintsos SA. Bariotakis M, et al. Biology (Basel). 2023 Oct 11;12(10):1327. doi: 10.3390/biology12101327. Biology (Basel). 2023. PMID: 37887037 Free PMC article.
  • Global plant trait relationships extend to the climatic extremes of the tundra biome.
    Thomas HJD, Bjorkman AD, Myers-Smith IH, Elmendorf SC, Kattge J, Diaz S, Vellend M, Blok D, Cornelissen JHC, Forbes BC, Henry GHR, Hollister RD, Normand S, Prevéy JS, Rixen C, Schaepman-Strub G, Wilmking M, Wipf S, Cornwell WK, Beck PSA, Georges D, Goetz SJ, Guay KC, Rüger N, Soudzilovskaia NA, Spasojevic MJ, Alatalo JM, Alexander HD, Anadon-Rosell A, Angers-Blondin S, Te Beest M, Berner LT, Björk RG, Buchwal A, Buras A, Carbognani M, Christie KS, Collier LS, Cooper EJ, Elberling B, Eskelinen A, Frei ER, Grau O, Grogan P, Hallinger M, Heijmans MMPD, Hermanutz L, Hudson JMG, Johnstone JF, Hülber K, Iturrate-Garcia M, Iversen CM, Jaroszynska F, Kaarlejarvi E, Kulonen A, Lamarque LJ, Lantz TC, Lévesque E, Little CJ, Michelsen A, Milbau A, Nabe-Nielsen J, Nielsen SS, Ninot JM, Oberbauer SF, Olofsson J, Onipchenko VG, Petraglia A, Rumpf SB, Shetti R, Speed JDM, Suding KN, Tape KD, Tomaselli M, Trant AJ, Treier UA, Tremblay M, Venn SE, Vowles T, Weijers S, Wookey PA, Zamin TJ, Bahn M, Blonder B, van Bodegom PM, Bond-Lamberty B, Campetella G, Cerabolini BEL, Chapin FS 3rd, Craine JM, Dainese M, Green WA, Jansen S, Kleyer M, Manning P, Niinemets Ü, Onoda Y, Ozinga WA, Peñuelas J, Poschlod… See abstract for full author list ➔ Thomas HJD, et al. Nat Commun. 2020 Mar 12;11(1):1351. doi: 10.1038/s41467-020-15014-4. Nat Commun. 2020. PMID: 32165619 Free PMC article.
  • Plant traits poorly predict winner and loser shrub species in a warming tundra biome.
    García Criado M, Myers-Smith IH, Bjorkman AD, Normand S, Blach-Overgaard A, Thomas HJD, Eskelinen A, Happonen K, Alatalo JM, Anadon-Rosell A, Aubin I, Te Beest M, Betway-May KR, Blok D, Buras A, Cerabolini BEL, Christie K, Cornelissen JHC, Forbes BC, Frei ER, Grogan P, Hermanutz L, Hollister RD, Hudson J, Iturrate-Garcia M, Kaarlejärvi E, Kleyer M, Lamarque LJ, Lembrechts JJ, Lévesque E, Luoto M, Macek P, May JL, Prevéy JS, Schaepman-Strub G, Sheremetiev SN, Siegwart Collier L, Soudzilovskaia NA, Trant A, Venn SE, Virkkala AM. García Criado M, et al. Nat Commun. 2023 Jun 28;14(1):3837. doi: 10.1038/s41467-023-39573-4. Nat Commun. 2023. PMID: 37380662 Free PMC article.

References

    1. Anderegg, L. D. L. , Berner, L. T. , Badgley, G. , Sethi, M. L. , Law, B. E. , & HilleRisLambers, J. (2018). Within‐species patterns challenge our understanding of the leaf economics spectrum. Ecology Letters, 21(5), 734–744. 10.1111/ele.12945 - DOI - PubMed
    1. Bardgett, R. D. , Mommer, L. , & De Vries, F. T. (2014). Going underground: Root traits as drivers of ecosystem processes. Trends in Ecology and Evolution, 29, 692–699. 10.1016/j.tree.2014.10.006 - DOI - PubMed
    1. Bjorkman, A. , Myers‐Smith, I. , Elmendorf, S. , Normand, S. , Thomas, H. , Alatalo, J. , … Zamin, T. (2018a). Tundra Trait Team: A database of plant traits spanning the tundra biome. Global Ecology and Biogeography. 27, 1402–1411.
    1. Bjorkman, A. D. , Myers‐Smith, I. H. , Elmendorf, S. C. , Normand, S. , Rüger, N. , Beck, P. S. , … Georges, D. (2018b). Plant functional trait change across a warming tundra biome. Nature, 562, 57–62. - PubMed
    1. Bliss, L. C. , Heal, O. W. , & Moore, J. J. (1981). Tundra ecosystems: A comparative analysis. New York, NY: Cambridge University Press.