

Construction and comprehensive analysis of a ceRNA network to reveal potential prognostic biomarkers for hepatocellular carcinoma
- PMID: 31007608
- PMCID: PMC6458652
- DOI: 10.1186/s12935-019-0817-y
Construction and comprehensive analysis of a ceRNA network to reveal potential prognostic biomarkers for hepatocellular carcinoma
Abstract
Background: Long noncoding RNAs (lncRNAs) can act as microRNA (miRNA) sponges to regulate protein-coding gene expression; therefore, lncRNAs are considered a major part of the competitive endogenous RNA (ceRNA) network and have attracted growing attention. The present study explored the regulatory mechanisms and functional roles of lncRNAs as ceRNAs in hepatocellular carcinoma (HCC) and their potential impact on HCC patient prognosis.
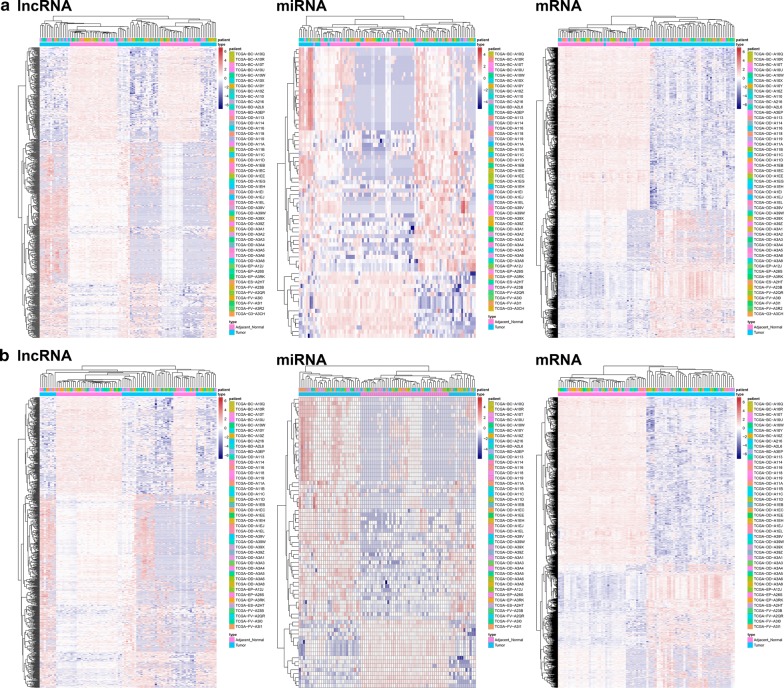
Methods: In this study, we systematically studied the expression profiles and prognostic value of lncRNA, miRNA, and mRNA from a total of 838 HCC patients from five HCC cohorts (TCGA, GSE54236, GSE76427, GSE64041 and GSE14520). The TCGA, GSE54236 and GSE76427 HCC cohorts were utilized to establish a prognosis-related network of dysregulated ceRNAs by bioinformatics methods. The GSE64041 and GSE14520 HCC cohorts were utilized to verify the expression of candidate genes.
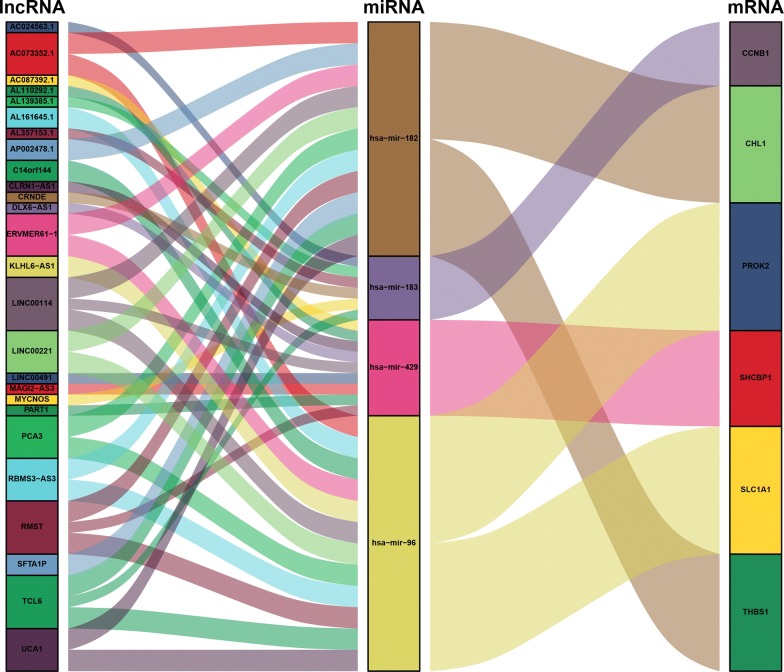
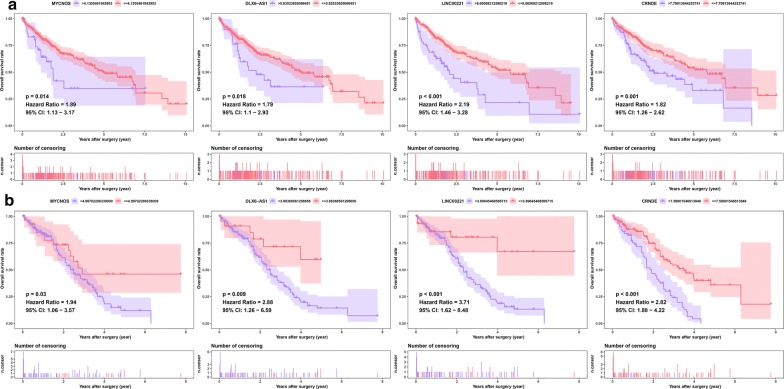
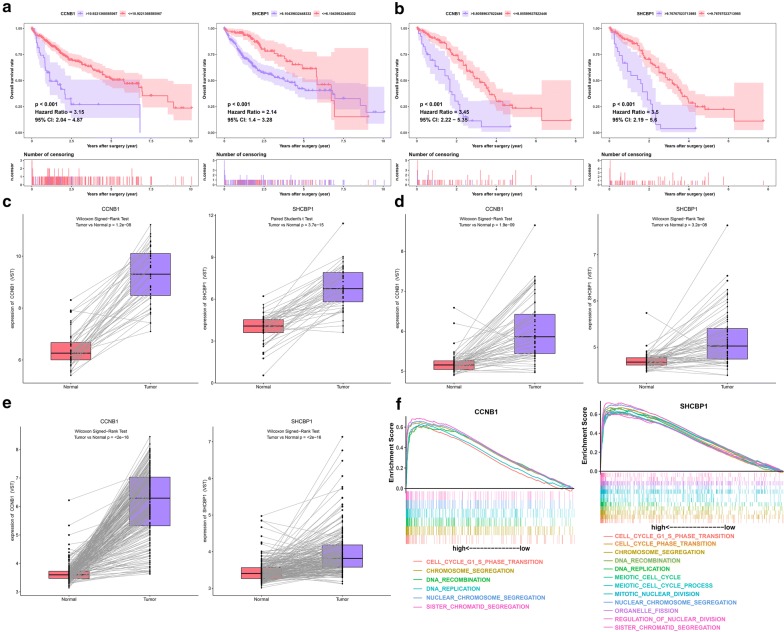
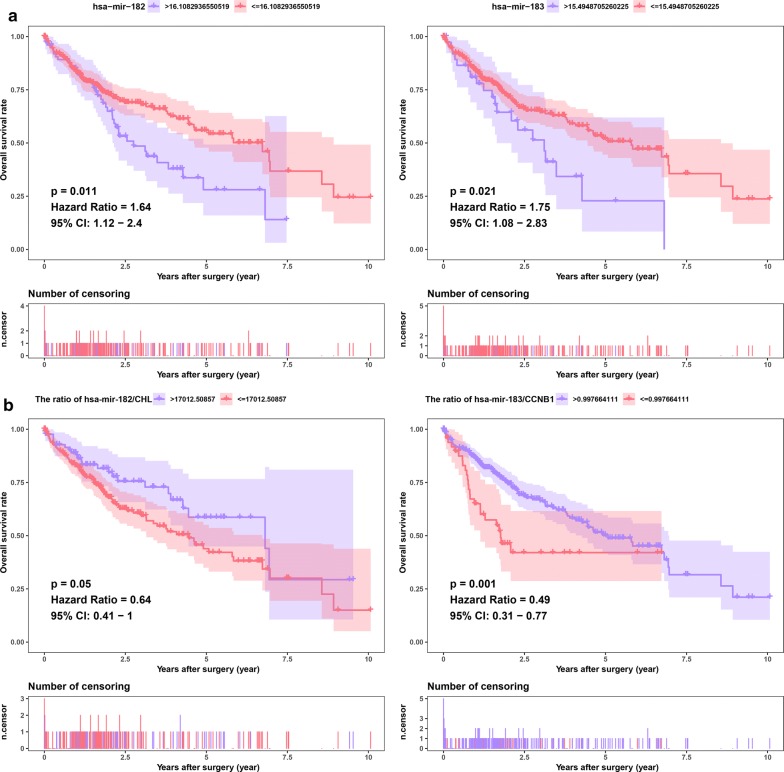
Results: In total, 721 lncRNAs, 73 miRNAs, and 1563 mRNAs were aberrantly expressed in HCC samples. A ceRNA network including 26 lncRNAs, four miRNAs, and six mRNAs specific to HCC was established. The survival analysis showed that four lncRNAs (MYCNOS, DLX6-AS1, LINC00221, and CRNDE) and two mRNAs (CCNB1 and SHCBP1) were prognostic biomarkers for patients with HCC in both the TCGA and GEO databases.
Conclusion: The proposed ceRNA network may help elucidate the regulatory mechanism by which lncRNAs function as ceRNAs and contribute to the pathogenesis of HCC. Importantly, the candidate lncRNAs, miRNAs, and mRNAs involved in the ceRNA network can be further evaluated as potential therapeutic targets and prognostic biomarkers for HCC.
Keywords: Competing endogenous RNA; Hepatocellular carcinoma; Long noncoding RNA; MicroRNA; Prognosis.
Conflict of interest statement
The authors declare that they have no competing interests.
Figures
References
-
- Galun D, Bogdanovic A, Djokic Kovac J, Bulajic P, Loncar Z, Zuvela M. Preoperative neutrophil-to-lymphocyte ratio as a prognostic predictor after curative-intent surgery for hepatocellular carcinoma: experience from a developing country. Cancer Manag Res. 2018;10:977–988. doi: 10.2147/CMAR.S161398. - DOI - PMC - PubMed
LinkOut - more resources
Full Text Sources
Miscellaneous
