. 2019 Mar 26;6(2):ENEURO.0424-18.2019.
doi: 10.1523/ENEURO.0424-18.2019. eCollection 2019 Mar-Apr.

The Rat Medial Prefrontal Cortex Exhibits Flexible Neural Activity States during the Performance of an Odor Span Task

Affiliations

The Rat Medial Prefrontal Cortex Exhibits Flexible Neural Activity States during the Performance of an Odor Span Task

Emanuela De Falco et al. eNeuro. .

Abstract

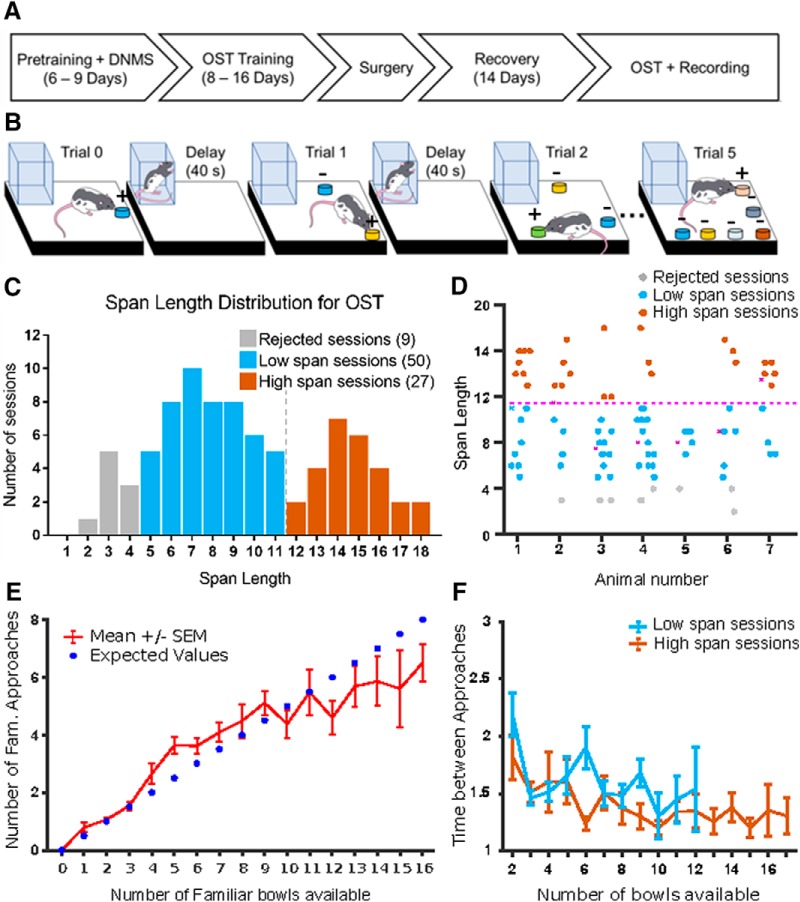
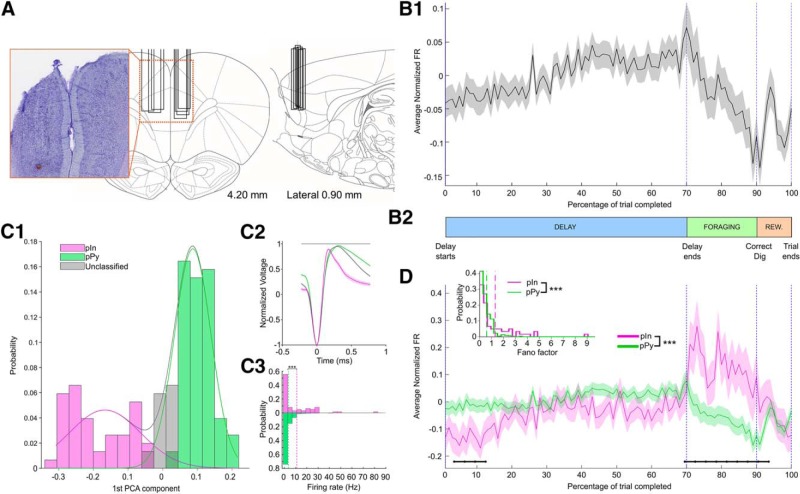
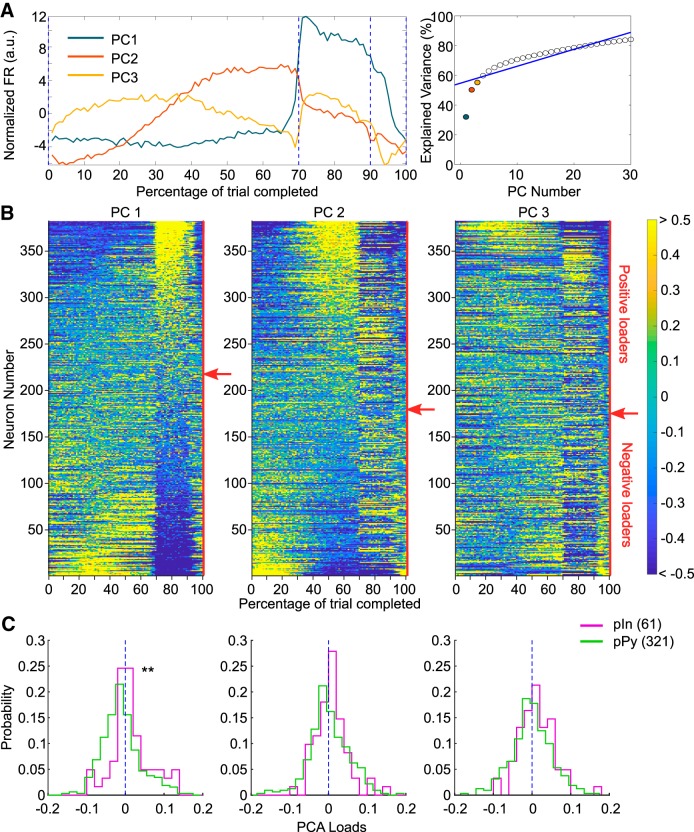
Medial prefrontal cortex (mPFC) activity is fundamental for working memory (WM), attention, and behavioral inhibition; however, a comprehensive understanding of the neural computations underlying these processes is still forthcoming. Toward this goal, neural recordings were obtained from the mPFC of awake, behaving rats performing an odor span task of WM capacity. Neural populations were observed to encode distinct task epochs and the transitions between epochs were accompanied by abrupt shifts in neural activity patterns. Putative pyramidal neuron activity increased earlier in the delay for sessions where rats achieved higher spans. Furthermore, increased putative interneuron activity was only observed at the termination of the delay thus indicating that local processing in inhibitory networks was a unique feature to initiate foraging. During foraging, changes in neural activity patterns associated with the approach to a novel odor, but not familiar odors, were robust. Collectively, these data suggest that distinct mPFC activity states underlie the delay, foraging, and reward epochs of the odor span task. Transitions between these states likely enables adaptive behavior in dynamic environments that place strong demands on the substrates of working memory.

Keywords: electrophysiology; multivariate statistics; odor; prefrontal cortex; pyramidal neuron; working memory.


Figures

Figure 1.
Figure 1.
A, Timeline depicting experimental events. Pretraining and DNMS required 6–9 d of training. Training on the OST required 8–16 d of training. Following OST, animals underwent electrode implantation surgery and were allowed 14 d to recover. Following recovery, OST resumed, and electrophysiological recording occurred. B, OST consists of successive trials in which the animal must identify a novel odor and dig to receive a food reward. Different colors indicate different odors. With each successive trial, a new odor bowl (+) is added, while the previous odors (−) are rearranged pseudorandomly. Between each trial the animal returns to a clear Plexiglas house for an intertrial delay period of ∼40 s. OST continues until the animals fails to dig in the novel bowl. Span length is determined as the number trials successfully completed. C, Distribution of span lengths across the 86 recording sessions. The distribution is not unimodal (Calibrated Hartigan’s dip test, D(86) = 0.048, p = 7.2 × 10⁻³). The local minimum between the two peaks (span = 11.5, black dotted line) was taken as threshold to classify the sessions into Low span (blue) and High span (red). Nine sessions with a span length smaller than five were excluded from the following analysis (grey). D, Span length for each session plotted by individual rats. Most rats (6/7) had both low and high span sessions (ANOVA test, F(6,79) = 1.78, p = 0.11). E, Average number (±SEM) of familiar bowl approaches versus number of familiar bowls available (red). The numbers of bowls visited prior to a correct dig was compatible with the statistically expected ones (blue dots; FDR-corrected t test, p > 0.05 for all spans). F, Average time (±SEM) between approaches versus number of bowls available in High and Low span sessions. No difference was found for any number of bowls between 2 and 12 false discovery rate (FDR-corrected t test, p > 0.05).
Figure 2.
Figure 2.
Task-normalized firing rates for pyramidal cells and interneurons. A, D, Coronal and sagittal rat brain sections depicting the location of the recording sites and photograph of a representative electrode placement. Probes were located in the prelimbic region of the mPFC. Box indicate the medial-lateral (left) and anterior–posterior (right) locations of the electrode arrays. B1, Grand-average (±SEM) of task-normalized firing rate for 382 neurons recorded across 77 recording sessions. Firing rates were z-scored before averaging across neurons. B2, Timeline of a single trial, where the three main epochs of the task (Delay, Foraging, and Reward) were identified through the four behavioral timestamps: Delay starts; Delay ends; Correct dig; and End of trial. Specific percentages of completion were assigned to each task epoch to calculate the task-normalized firing rates (see Data analysis – Task normalized firing rates). C1, Distribution of first PCA components (integrating two waveform features) for pIn, pPy, and unclassified neurons. The Gaussian fits used for the classification are shown as continuous lines on top of the distribution. C2, Mean waveforms (±SEM) for the three classes of neurons detailed in C1. Unclassified neurons had a mean waveform closer to the pPy class and where subsequently labeled as pPys. C3, Distribution of mean firing rates for 61 pIns and 321 pPy. Firing rates were higher in the pIn population than in the pPy one (Kolmogorov–Smirnov test, D(321,61) = 0.30, p = 1.1 × 10⁻⁴). Vertical dotted lines mark the mean value of each distribution. D, Grand-average (±SEM) of task-normalized firing rate for pIns and pPys. The firing rates in the two classes were significantly different (two-way ANOVA, interaction cell class × time, F(99,38000) = 3.02, p = 8.4 × 10⁻²²). Black horizontal lines mark groups of time bins with significant differences between pIns and pPy (FDR-corrected rank-sum, p < 0.05). Top Left, Distribution of Fano factors for pPys versus pIns (dotted lines mark mean values). Pins exhibit higher trial-to- trial variability (Kolmogorov–Smirnov test, D(321,61) = 0.30, p = 9.8 × 10⁻⁵). ***p < 0.001.
Figure 3.
Figure 3.
Identification of neural populations via PCA. A, First three PCs. Projection of firing rates for the 382 neurons along the first three principal eigenvectors identified through PCA (left) and variance explained by each PC (right; blue line marks the broken stick model fit on the data). The first three PCs together explained 56% of the original variance of the dataset. B, Task-normalized firing rates for the 382 neurons identified sorted according to their loadings on first, second, and third PC (left, center, and right, respectively). Red arrows on the right side of each color-plot indicates the transition point between positive and negative loaders. C, Distributions of loadings on each PC separated for pIns and pPys. On the first PC pIns’ loadings were significantly higher than pPys’ ones (left; Kolmogorov–Smirnov test: D(321,61) = 0.24, p = 4.9 × 10⁻³), whereas no significant effect was found on the other two PCs (Kolmogorov–Smirnov test: D(321,61) = 0.10, p = 0.63 for PC2; D(321,61) = 0.12, p = 0.37). **p < 0.01.
Figure 4.
Figure 4.
Activity of pyramidal neurons is predictive of span. A, Grand-average (±SEM) of task-normalized firing rate for 321 pPys, separated according to the session’s span (low and high span were defined according to the threshold identified in Fig. 1C). Firing rates in the two groups were significantly different (two-way ANOVA, interaction between span class and time bin, F(99,31900) = 1.72, p = 1.1 × 10⁻⁵). Black horizontal lines mark groups of time bins showing significant differences between low and high span groups (FDR-corrected rank sum, p < 0.05). B, Grand-average (±SEM) of task-normalized firing rate for 61 pIns, separated according to the session’s span. Firing rates in the two groups were not significantly different (two-way ANOVA, interaction between span class and time bin F(99,5900) = 0.87, p = 0.81). ***p < 0.001.
Figure 5.
Figure 5.
Identification of subpopulations of pyramidal neurons. A1, AIC for the PCA-features k-means clustering, calculated for different number of clusters (k). The selected number of clusters (k = 4) was identified through a broken stick fit (cyan line). A2, Loadings on the first 3 PCs for the population of 321 pPys clustered. Different colors indicate the different classes assigned. A3, Average (±SEM) task-normalized firing rate for each of the classes identified. B, Grand-average (±SEM) of task-normalized firing rate for each class of pPys, separated according to the session’s span (low or high). Only firing rates in Class 2 were significantly different (two-way ANOVA, interaction span class × time, F(99,7000) = 3.59, p = 1.4 × 10⁻²⁹). Black horizontal lines mark groups of time bins showing significant differences between low and high span groups (FDR-corrected rank sum, p < 0.05). No significant differences between firing rates in the low and high span sessions were observed in the remaining classes (two-way ANOVA, interaction span class × time: F(99,15300) = 1.23, p = 0.06 for Class 1; F(99,4700) = 0.93, p = 0.67 for Class 3; F(99,4300) = 1.18, p = 0.11 for Class 4. ***p < 0.001.
Figure 6.
Figure 6.
Distinct neural trajectories for familiar and novel odor approaches. A, Neural activity trajectories in the PC space for 188 pyramidal neurons around familiar and novel approaches (time interval −2 to 2 s around each event, first 3 PCs explaining 56% of variance). Arrows indicate module and direction of trajectories’ speed. B1B3, Average normalized firing rates (±SEM) for positive and negative PC loaders for familiar approaches (left) and novel approaches (right). Loadings were obtained considering a time interval from −2 s to 0.3 s around each event. C, Empirical cumulative distribution function (CDF) of absolute loadings on the first three PCs for familiar and novel approaches (time interval −2 s to 0.3 s around each event, first 3 PCs explaining 74% of variance). Absolute loading distributions in the two classes were different (Kolmogorov–Smirnov test: D(188,188) = 0.22, p = 2.0 × 10⁻⁴ for PC1; D(188,188) = 0.19, p = 2.5 × 10⁻³ for PC2; D(188,188) = 0.15, p = 2.7 × 10⁻² for PC3). *p < 0.05; **p < 0.01; ***p < 0.001.
Figure 7.
Figure 7.
Divergence of the neural trajectory following an incorrect choice. A, Neural activity trajectories in the PC space for 125 pPys during consecutive correct trials (1–9) and incorrect trials (black). Arrows indicate module and direction of trajectories’ speed. Different epochs of the task are color coded, transition between foraging and error epochs corresponds to a Correct dig for the correct trials and to an Error dig for the incorrect ones, trial progression is color-coded from darker to lighter. B, Task-normalized firing rates for 237 pPys sorted according to their loadings on PC3 for correct (left) and incorrect (right) trials. PCA was performed on trial-normalized firing rates, and PC3 identified the error signal. Red vertical lines mark the End of the delay and the Dig event. Red arrows on the right side of each color-plot indicates the transition point between positive and negative loaders. C, Grand-average (±SEM) of task-normalized firing rate for the top 30% positive loaders on PC3 (30 pPys) on correct and incorrect trials. Firing rates in the two groups were significantly different (two-way ANOVA, interaction between kind of trial and time bin, F(99,5800) = 1.59, p = 2.0 × 10⁻⁴). Black horizontal markers indicate groups of time bins showing significant differences between correct and incorrect trials (FDR-corrected rank sum, p < 0.05). ***p < 0.001.

Similar articles

Cited by

References

    1. Akaike H (1974) A new look at the statistical model identification. IEEE Trans Automat Contr 19:716-723. 10.1109/TAC.1974.1100705 - DOI
    1. April LB, Bruce K, Galizio M (2013) The magic number 70 (plus or minus 20): variables determining performance in the rodent odor span task. Learn Motiv 44:143-158. 10.1016/j.lmot.2013.03.001 - DOI - PMC - PubMed
    1. Ardid S, Vinck M, Kaping D, Marquez S, Everling S, Womelsdorf T (2015) Mapping of functionally characterized cell classes onto canonical circuit operations in primate prefrontal cortex. J Neurosci 35:2975-2991. 10.1523/JNEUROSCI.2700-14.2015 - DOI - PMC - PubMed
    1. Balaguer-Ballester E, Lapish CC, Seamans JK, Durstewitz D (2011) Attracting dynamics of frontal cortex ensembles during memory-guided decision-making. PLoS Comput Biol 7:e1002057. 10.1371/journal.pcbi.1002057 - DOI - PMC - PubMed
    1. Balaguer-Ballester E, Moreno-Bote R, Deco G, Durstewitz D (2018) Metastable dynamics of neural ensembles. Front Syst Neurosci 11:99. - PMC - PubMed

Publication types

LinkOut - more resources