. 2019 Jun 1;29(6):2759-2770.
doi: 10.1093/cercor/bhz049.

Between Perfectly Critical and Fully Irregular: A Reverberating Model Captures and Predicts Cortical Spike Propagation

Affiliations

Between Perfectly Critical and Fully Irregular: A Reverberating Model Captures and Predicts Cortical Spike Propagation

J Wilting et al. Cereb Cortex. .

Abstract

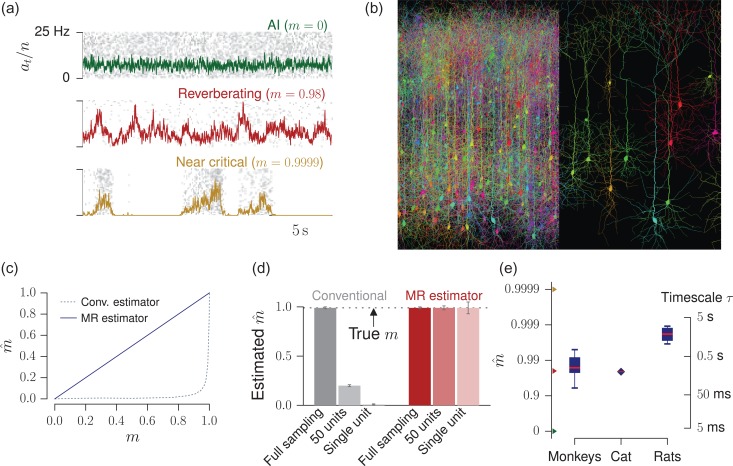
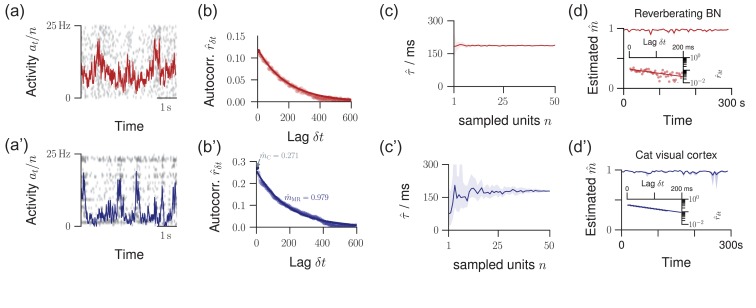
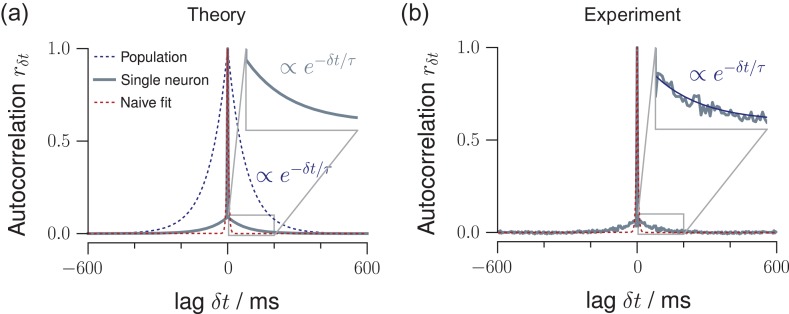
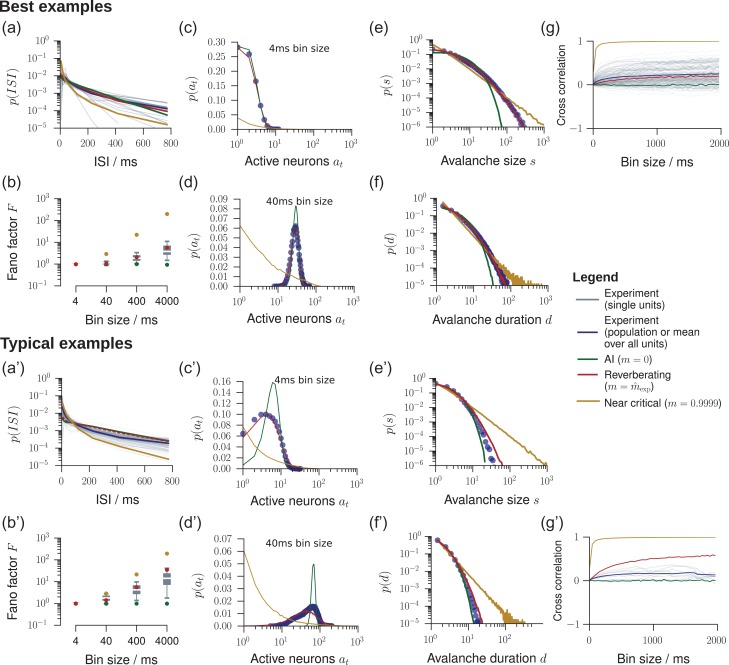
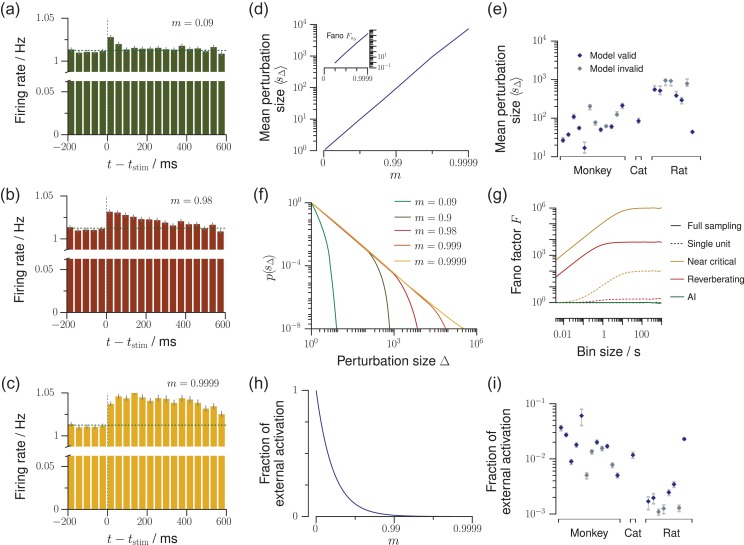
Knowledge about the collective dynamics of cortical spiking is very informative about the underlying coding principles. However, even most basic properties are not known with certainty, because their assessment is hampered by spatial subsampling, i.e., the limitation that only a tiny fraction of all neurons can be recorded simultaneously with millisecond precision. Building on a novel, subsampling-invariant estimator, we fit and carefully validate a minimal model for cortical spike propagation. The model interpolates between two prominent states: asynchronous and critical. We find neither of them in cortical spike recordings across various species, but instead identify a narrow "reverberating" regime. This approach enables us to predict yet unknown properties from very short recordings and for every circuit individually, including responses to minimal perturbations, intrinsic network timescales, and the strength of external input compared to recurrent activation "thereby informing about the underlying coding principles for each circuit, area, state and task.

Keywords: balanced state; criticality; perturbations; timescales.


Figures

Figure 1.
Figure 1.
Reverberating versus critical and irregular dynamics under subsampling. (a) Raster plot and population rate at for networks with different spike propagation parameters or neural efficacy m. They exhibit vastly different dynamics, which readily manifest in the population activity. (b) When recording spiking activity, only a small subset of all neurons can be sampled with millisecond precision. This spatial subsampling can hinder correct inference of collective properties of the whole network; figure created using TREES (Cuntz et al. 2010) and reproduced from Wilting and Priesemann (2018). (c) Estimated branching ratio mˆ as a function of the simulated, true branching ratio m, inferred from subsampled activity (100 out of 10 000 neurons). While the conventional estimator misclassified m from this subsampled observation (gray, dotted line), the novel multistep regression (MR) estimator returned the correct values. (d) For a reverberating branching model with m= 0.98, the conventional estimator inferred mˆ= 0.21 or mˆ= 0.002 when sampling 50 or 1 units, respectively, in contrast to MR estimation, which returned the correct mˆ even under strong subsampling. (e) Using the novel MR estimator, cortical network dynamics in monkey prefrontal cortex, cat visual cortex, and rat hippocampus consistently showed reverberating dynamics, with (median mˆ= 0.98 over all experimental sessions, boxplots indicate median/25–75%/0–100% over experimental sessions per species). These correspond to intrinsic network timescales between 80 ms and 2 s.
Figure 2.
Figure 2.
Validation of the model assumptions. The top row displays properties from a reverberating model, the bottom row spike recordings from cat visual cortex. (a/a’) Raster plot and population activity at within bins of Δt= 4ms, sampled from n= 50 neurons. (b/b’) Multistep regression (MR) estimation from the subsampled activity (5 min recording). The predicted exponential relation rδtmδt/Δt=exp(δt/τ) provides a validation of the applicability of the model. The experimental data are fitted by this exponential with remarkable precision. (c/c’) When subsampling even further, MR estimation always returns the correct timescale τˆ (or mˆ) in the model. In the experiment, this invariance to subsampling also holds, down to n10 neurons (shaded area: 16–84% confidence intervals estimated from 50 subsets of n neurons). (d/d’) The estimated branching parameter mˆ for 59 windows of 5s length suggests stationarity of m over the entire recording (shaded area: 16–84% confidence intervals). The variability in mˆ over consecutive windows was comparable for experimental recording and the matched model (p= 0.09, Levene test). Insets: exponential decay exemplified for one example window each.
Figure 3.
Figure 3.
MR estimation and intrinsic network timescales. (a) In a branching model, the autocorrelation function of the population activity decays exponentially with an intrinsic network timescale τ (blue dotted line). In contrast, the autocorrelation function for single neurons shows a sharp drop from r0= 1 at lag δt= 0 to the next lag r±Δt (gray solid line). We showed previously that this drop is a subsampling-induced bias. When ignoring the zero-lag value, the autocorrelation strength is decreased, but the exponential decay and even the value of the intrinsic network timescale τ of the network activity are preserved (inset). The red, dashed line shows a potential, naive exponential function, fitted to the single-neuron autocorrelation function (gray). This naive fit would return a much smaller τ. (b) The autocorrelation function of single-neuron activity recorded in cat visual cortex (gray) precisely resembles this theoretical prediction, namely a sharp drop and then an exponential decay (blue, inset), which persists over more than 100 ms. A naive exponential fit (red) to the single-neuron data would return an extremely short τ.
Figure 4.
Figure 4.
Model validation for in vivo spiking activity. We validated our model by comparing experimental results to predictions obtained from the in vivo-like, reverberating model, which was matched to the recording in the mean rate, inferred m, and number of recorded neurons. In general, the experimental results (gray or blue) were best matched by this reverberating model (red), compared to asynchronous-irregular (AI, green) and near-critical (yellow) models. From all experimental sessions, best examples (top) and typical examples (bottom) are displayed. For results from all experimental sessions see Figs S2–S8. (a/a’) Inter-spike-interval (ISI) distributions. (b/b’) Fano factors of single neurons for bin sizes between 4 ms and 4 s. (c/c’) Distribution of spikes per bin p(at) at a bin size of 4 ms. (d/d’) Same as c/c’ with a bin size of 40 ms. (e/e’) Avalanche size distributions p(s) for all sampled units. AI activity lacks large avalanches, near-critical activity produces power-law distributed avalanches, even under subsampling. (f/f’) Same as e/e’, but for the avalanche duration distributions p(d). (g/g’) Spike count cross-correlations (rsc) as a function of the bin size.
Figure 5.
Figure 5.
Predictions about network dynamics and propagation of perturbations. Using our in vivo-like, reverberating model, we can predict several network properties, which are yet very complicated or impossible to obtain experimentally. (ac) In response to one single extra spike, a perturbation propagates in the network depending on the branching ratio m, and can be observed as a small increase of the average firing rate of the sampled neurons, here simulated for 500 trials (as in London et al. 2010). This increase of firing rate decays exponentially, with the decay time τ being determined by m. The perturbation a is rapidly quenched in the asynchronous-irregular state, b decays slowly over hundreds of milliseconds in the reverberating state, or c persists almost infinitely in the critical state. (d) The average perturbation size sΔ and Fano factor FsΔ (inset) increase strongly with m. (e) Average total perturbation sizes predicted for each spike recording of mammalian cortex (errorbars: 5–95% confidence intervals). (f) Distribution p(sΔ) of total perturbation sizes sΔ. The asynchronous-irregular models show approximately Poisson distributed, near-critical models power-law distributed perturbation sizes. (g) Bin size dependent Fano factors of the activity, here exemplarily shown for the asynchronous-irregular (m= 0, green), representative reverberating (m= 0.98, red), and near critical (m= 0.9999, yellow) models. While the directly measurable Fano factor of single neurons (dotted lines) underestimates the Fano factor of the whole network, the model allows to predict the Fano factor of the whole network (solid lines). (h) The fraction of the externally generated spikes compared to all spikes in the network strongly decreases with larger m. (i) Fraction of the externally generated spikes predicted for each spike recording of mammalian cortex (errorbars as in e).

Similar articles

Cited by

References

    1. Atick JJ. 1992. Could information theory provide an ecological theory of sensory processing? Network-Comp Neural. 3(2):213–251. - PubMed
    1. Bak P, Tang C, Wiesenfeld K. 1987. Self-organized criticality: an explanation of the 1/f noise. Phys Rev Lett. 59(4):381–384. - PubMed
    1. Barlow HB. 2012. Possible principles underlying the transformations of sensory messages In: Rosenblith WA, editor. Sensory communication. Cambridge, MA: The MIT Press; p. 217–234.
    1. Beggs JM, Plenz D. 2003. Neuronal avalanches in neocortical circuits. J Neurosci. 23(35):11167–11177. - PMC - PubMed
    1. Beggs JM, Timme N. 2012. Being critical of criticality in the brain. Front Physiol. 3:1–14. JUN(June). - PMC - PubMed

Publication types