. 2019 May;160(5):1103-1118.
doi: 10.1097/j.pain.0000000000001488.

Adenosine A3 receptor activation inhibits pronociceptive N-type Ca2+ currents and cell excitability in dorsal root ganglion neurons

Affiliations

Adenosine A3 receptor activation inhibits pronociceptive N-type Ca2+ currents and cell excitability in dorsal root ganglion neurons

Elisabetta Coppi et al. Pain. 2019 May.

Abstract

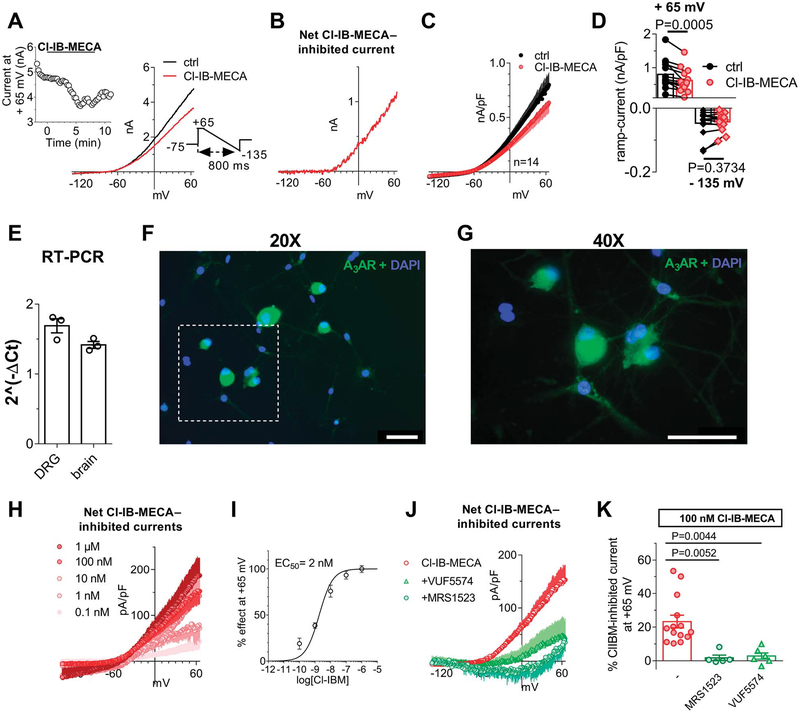
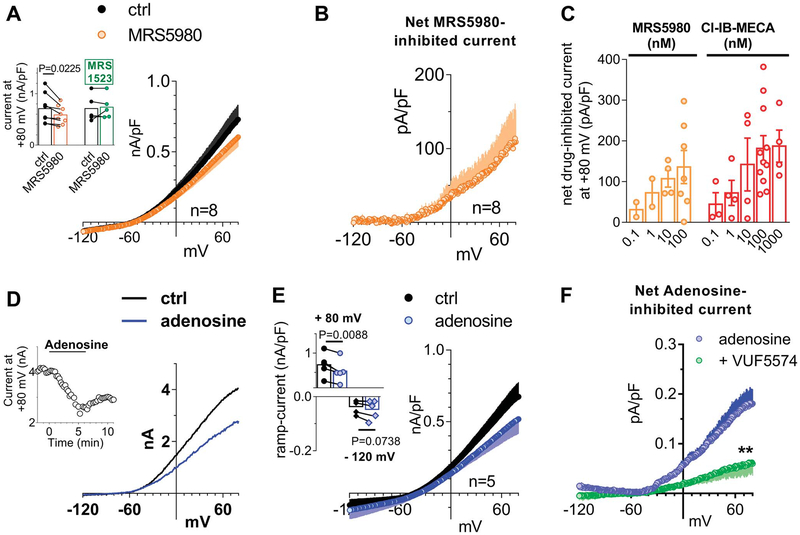
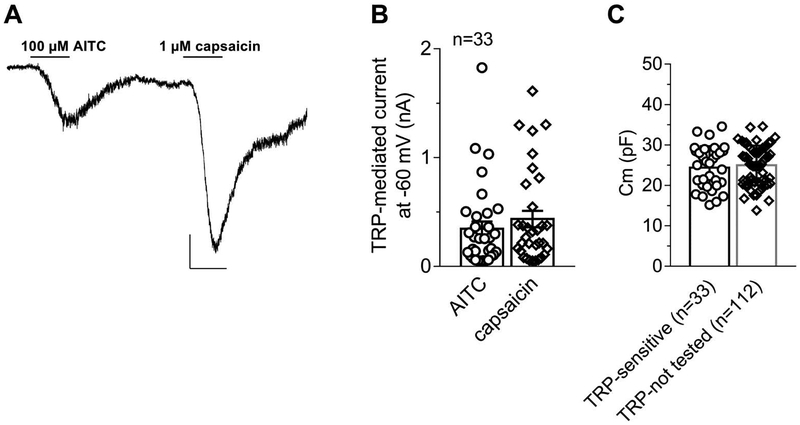
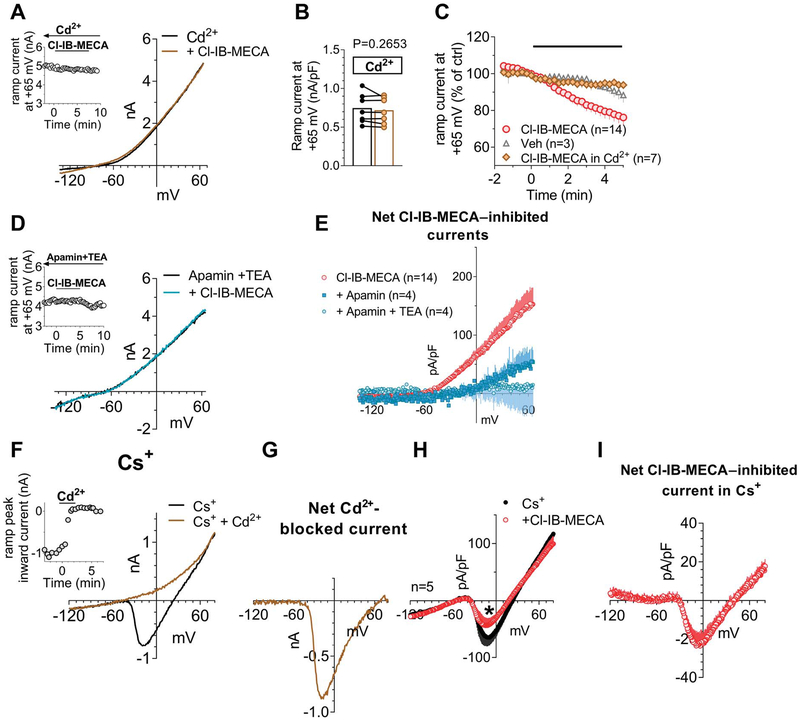
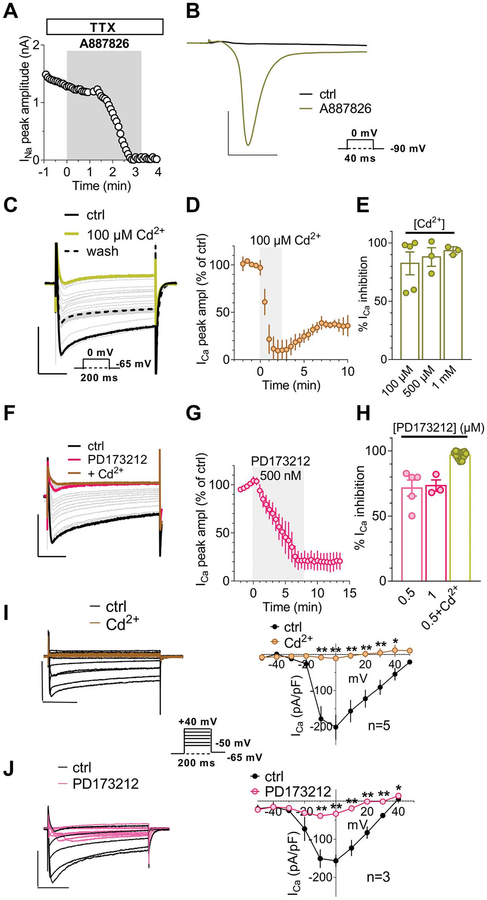
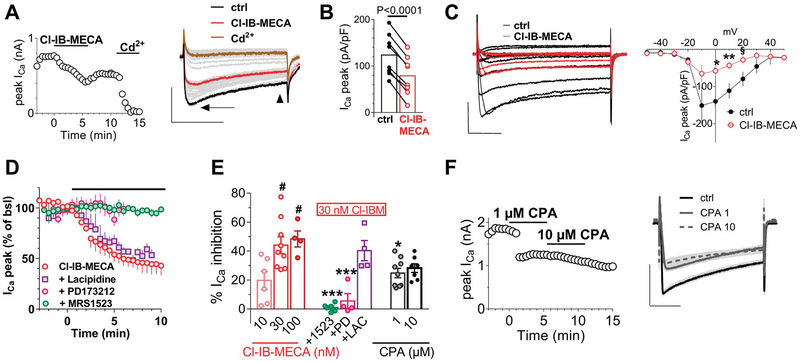
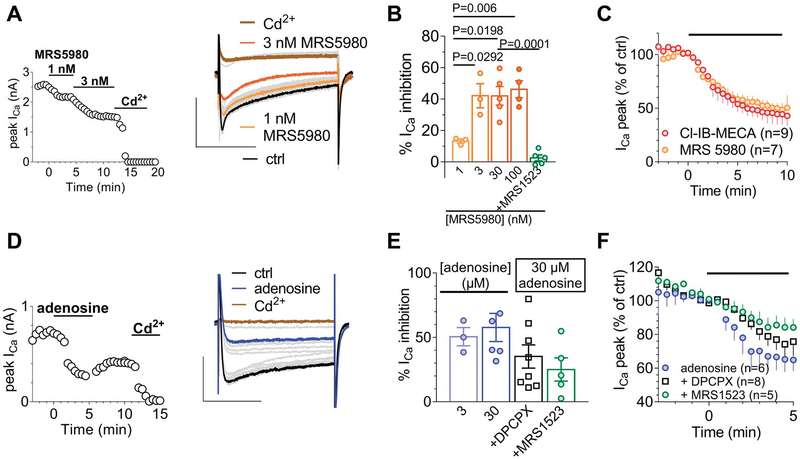
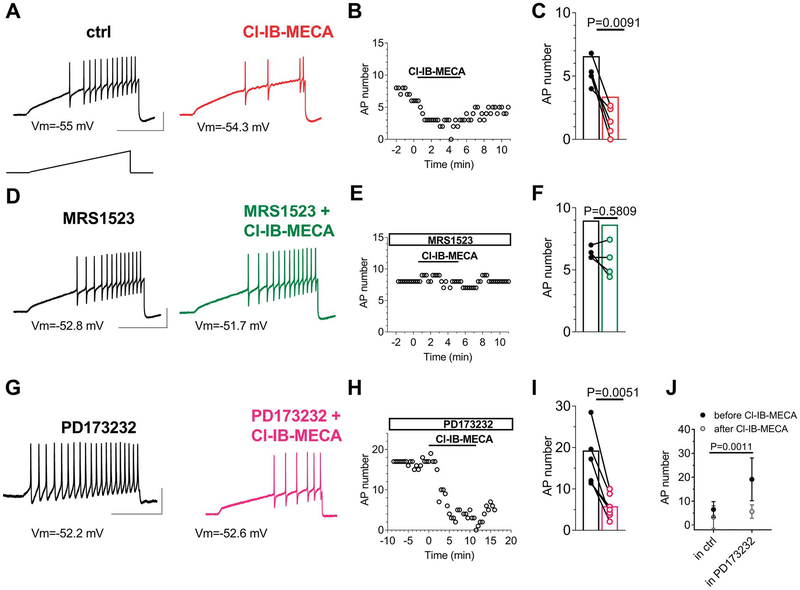
Recently, studies have focused on the antihyperalgesic activity of the A3 adenosine receptor (A3AR) in several chronic pain models, but the cellular and molecular basis of this effect is still unknown. Here, we investigated the expression and functional effects of A3AR on the excitability of small- to medium-sized, capsaicin-sensitive, dorsal root ganglion (DRG) neurons isolated from 3- to 4-week-old rats. Real-time quantitative polymerase chain reaction experiments and immunofluorescence analysis revealed A3AR expression in DRG neurons. Patch-clamp experiments demonstrated that 2 distinct A3AR agonists, Cl-IB-MECA and the highly selective MRS5980, inhibited Ca-activated K (KCa) currents evoked by a voltage-ramp protocol. This effect was dependent on a reduction in Ca influx via N-type voltage-dependent Ca channels, as Cl-IB-MECA-induced inhibition was sensitive to the N-type blocker PD173212 but not to the L-type blocker, lacidipine. The endogenous agonist adenosine also reduced N-type Ca currents, and its effect was inhibited by 56% in the presence of A3AR antagonist MRS1523, demonstrating that the majority of adenosine's effect is mediated by this receptor subtype. Current-clamp recordings demonstrated that neuronal firing of rat DRG neurons was also significantly reduced by A3AR activation in a MRS1523-sensitive but PD173212-insensitive manner. Intracellular Ca measurements confirmed the inhibitory role of A3AR on DRG neuronal firing. We conclude that pain-relieving effects observed on A3AR activation could be mediated through N-type Ca channel block and action potential inhibition as independent mechanisms in isolated rat DRG neurons. These findings support A3AR-based therapy as a viable approach to alleviate pain in different pathologies.


Conflict of interest statement

Conflict of interest statement

D.S. is a co-founder of BioIntervene, Inc, that licensed related intellectual property from Saint Louis University. The remaining authors have no conflicts of interest to declare.

Figures

Figure 1.
Figure 1.
Selective A3AR activation inhibits ramp-evoked outward currents in cultured rat DRG neurons. (A) Left panel: original patch-clamp current traces recorded in a representative cell where a voltage-ramp protocol (+65/−135 mV, 800 ms: lower inset) was applied before (ctrl), during, and after Cl-IB-MECA (100 nM) superfusion. Upper inset: time course of ramp-evoked currents at +65 mV in the same cell. (B) Net Cl-IB-MECA–inhibited current, obtained by subtraction of the ramp recorded in Cl-IB-MECA from the control ramp, in the same cell. (C and D) Averaged ramp traces (C) and pooled data at +65 and −135 mV (D) of ramp-evoked currents measured in the absence or presence of Cl-IB-MECA in 14 cells investigated. P = 0.0005 at +65 mV; P = 0.3734 at −135 mV; the paired Student t test, n = 14. (E) Real-time polymerase chain reaction experiments demonstrated that A3AR-coding mRNA is present in rat DRG homogenates. Data were normalized to A3 receptor expression as a fraction of the house-keeping gene GADPH (glyceraldehyde-3-phosphate dehydrogenase) and have been obtained in 3 independent experiments performed in triplicate. A brain tissue homogenate was taken as the positive control. (F and G) 20× (F) and 40× (G) magnification of A3AR immunofluorescent labelling (green) of DRG cultures. Cells nuclei were marked with DAPI (blue). Scale bar: 50 μm. (H) Averaged Cl-IB-MECA–inhibited currents at different agonist concentrations (0.1–1000 nM; at least n = 4 in each experimental condition). (I) Concentration-response curve of Cl-IB-MECA effect on ramp currents measured at +65 mV (confidence limit: from 1.2 to 3.2 nM). (J and K) Net 100 nM Cl-IB-MECA–inhibited currents (J) and respective pooled data at +65 mV (K) recorded in the absence or presence of 2 different A3AR antagonists: MRS1523 (100 nM; n = 5) and VUF5574 (100 nM; n = 6). One-way ANOVA, Bonferroni posttest. ANOVA, analysis of variance; DRG, dorsal root ganglion; RT-PCR, real-time polymerase chain reaction.
Figure 2.
Figure 2.
The newly synthetized, highly selective, A3AR agonist MRS5980 and the endogenous ligand adenosine mimic Cl-IB-MECA effect in inhibiting ramp-evoked outward currents in isolated rat DRG neurons. (A) Averaged traces of ramp-evoked currents measured before or after MRS5980 application (100 nM) in 8 cells investigated. Inset: pooled data or ramp-evoked current at +65 mV in the presence of MRS5980 alone or during coapplication with the A3AR antagonist MRS1523 (100 nM; n = 5). The paired Student t test. (B) Net MRS5980-inhibited current in 8 cells tested. (C) Comparison between net Cl-IB-MECA–or MRS5980-inhibited ramp currents measured at +65 mV at different agonists concentrations. (D) Original ramp current traces recorded in a representative cell before (ctrl), during, or after adenosine (30 μM) superfusion. Inset: time course of ramp-evoked currents at +65 mV in the same cell. (E) Pooled data of ramp-evoked currents at +65 mV or −135 mV before or after the application of adenosine in 5 cells investigated. P = 0.0088 at +65 mV; P = 0.0738 at −135 mV, the paired Student t test, n = 5. (F) Averaged adenosine-inhibited currents, obtained by subtraction of the adenosine ramp from the control ramp, recorded in the absence (n = 5) or presence of A3AR antagonist VUF5574 (100 nM, n = 6). **P = 0.0054 at + 65 mV, the unpaired Student t test. DRG, dorsal root ganglion.
Figure 3.
Figure 3.
Dorsal root ganglion (DRG) neurons responding to Cl-IB-MECA are nociceptors sensitive to the TRPV1 and TRPA1 agonists capsaicin and allyl isothiocyanate. (A) Original current trace recorded in a −75 mV-clamped cell after 10-minute washout of a previous Cl-IB-MECA application. Scale bars: 200 pA; 1 minute. (B) Pooled data of AITC- and capsaicin-activated currents in 33 cells investigated. (C) Pooled data of cell capacitance measured in AITC- and capsaicin-sensitive cells (“TRP-sensitive” neurons: n = 33) or in cells not exposed to capsaicin or AITC challenge (“TRP non-tested” neurons, n = 112). P = 0.8045, the unpaired Student t test. AITC, allyl isothiocyanate.
Figure 4.
Figure 4.
A3AR activation in DRG neurons inhibits Ca2+-activated K+ currents by reducing Ca2+ influx from voltage-dependent Ca2+ channels. (A) Original ramp current traces recorded in 1 mM Cd2+-containing extracellular solution before (ctrl) or during Cl-IB-MECA (100 nM) application in a representative cell. Inset: time course of ramp-evoked currents at +65 mV in the same cell. (B) Pooled data of ramp-evoked currents measured at +65 mV in the absence or presence of Cl-IB-MECA in Cd2+-containing extracellular solution in 7 cells investigated. P = 0.2653, the paired Student t test. (C) Averaged time course of ramp-evoked currents at +65 mV in the presence of Cl-IB-MECA (n = 14), its vehicle (Veh: 0.1% DMSO: n = 3), or Cl-IB-MECA in Cd2+ (n = 7). (D) Original ramp current traces recorded in apamin (100 nM) + tetraethylammonium (TEA, 200 μM) before (apamin + TEA) or during Cl-IB-MECA (100 nM) application in a representative cell. Inset: time course of ramp-evoked currents at +65 mV in the same cell. (E) Averaged Cl-IB-MECA–inhibited currents in the absence (n = 14) or presence of apamin alone (n = 4) or during coapplication with TEA (n = 4). (F) Original ramp current traces recorded before (ctrl) and during 1-mM Cd2+ application in a representative cell where extracellular and intracellular K+ were replaced by equimolar Cs+. Note that in these experimental conditions, a Cd2+-sensitive inward current appears, which presents an I–V relationship typical of Ca2+ currents. Inset: time course of ramp-evoked current measured at the inward peak in the same cell. (G) Net Cd2+-blocked Ca2+ current evoked by the ramp protocol in the same cell. (H) Averaged ramp-evoked currents recorded in Cs+-replacement conditions before (ctrl) or during Cl-IB-MECA (100 nM) application in 5 cells tested. *P = 0.0431, the paired Student t test. (I) Averaged Cl-IB-MECA–inhibited Ca2+ currents in Cs+-replacement experiments. DMSO, dimethyl sulphoxide; DRG, dorsal root ganglion.
Figure 5.
Figure 5.
The major component of Ca2+ currents recorded in DRG neurons is carried by N-type VDCC opening. (A) Time course of Na+ currents recorded in Cs+-replacement conditions in the presence of extracellular TTX (1 μM), Cd2+ (500 μM), and Ni2+ (100 μM) and activated every 5 seconds by a 0-mV step depolarization (40-ms duration, Vh = −90 mV: lower inset in (B)) before or during the application of Nav1.8 blocker A887826 (200 nM). (B) Original current traces recorded before and after 3-minute A887826 application. Scale bars: 3 nA; 10 ms. (C) Original current traces evoked in a typical DRG neuron by a 0-mV step depolarization (200 ms; Vh = −65 mV: lower inset) in the presence of extracellular TTX (1 μM), Ni2+ (100 μM), and A887826 (200 nM) before (ctrl) or during the application of 100-μM Cd2+. Scale bars: 1 nA; 50 ms. (D) Averaged time courses of Ca2+ currents, measured at the inward peak, before and during the application of the nonselective VDCC blocker 100-μM Cd2+ (n = 4). (E) Pooled data of Ca2+ current inhibition in the presence of 100-μM, 500-μM, or 1-mM Cd2+, n = 4. (F) Original current traces evoked in a typical DRG neuron by a 0-mV step depolarization (200 ms; Vh = −65 mV) in the presence of extracellular TTX (1 μM), Ni2+ (100 μM), and A887826 (200 nM) before (ctrl) or during the application of PD173212 (0.5 μM) and, subsequently, 500-μM Cd2+. Scale bars: 1 nA; 50 ms. (G) Averaged time courses of Ca2+ currents before and during the application of selective N-type Ca2+ channel blocker PD173212 (500 nM, n = 4). (H) Pooled data of Ca2+ current inhibition in the presence of 0.5-μM PD173212, 1-μM PD173212, or 0.5-μM PD173212 + 500-μM Cd2+. (I and J) Original current traces (left panels), and respective averaged I–V plots (right panels), of Ca2+ currents evoked by a series of 10 depolarizing voltage steps (from −50 to + 50 mV, 200-ms duration, Vh = −65 mV: see lower inset) before or during 500-μM Cd2+ (I) or 0.5-μM PD173212 (J) application. Scale bars: 1 nA; 50 ms. DRG, dorsal root ganglion; VDCC, voltage-dependent Ca2+ channel. *P < 0.05; **P < 0.01; ***P < 0.001, paired Student t-test.
Figure 6.
Figure 6.
Cl-IB-MECA inhibits N-type Ca2+ currents in DRG neurons. (A) Left panel: time course of peak Ca2+ currents (ICa) evoked by a 0-mV step depolarization in a typical DRG neuron. Note that Cl-IB-MECA (30 nM) inhibits Ca2+ currents that were completely abolished by a subsequent 500-μM Cd2+ application. Right panel: original current traces recorded in the same cell at significant time points. Scale bars: 0.5 nA, 100 ms. Arrow indicates peak Ca2+ currents, and arrowhead indicates steady-state Ca2+ currents. (B) Pooled data of peak ICa measured in the absence or presence of Cl-IB-MECA in 8 cells investigated. P < 0.0001, the paired Student t test. (C) Left panel: original Ca2+ current traces evoked by a series of depolarizing voltage steps (inset) before (ctrl) or after Cl-IB-MECA (30 nM) application in a representative cell. Right panel: averaged I–V plot of Ca2+ currents measured at the peak in 5 cells tested. *P = 0.0106; **P = 0.0066; § P = 0.0105, the paired Student t test. Scale bars: 0.5 nA, 50 ms. (D) Averaged time courses of peak Ca2+ current, expressed as % of baseline values, measured before or after the application of Cl-IB-MECA in different experimental groups. (E) Pooled data of Cl-IB-MECA–or CPA-inhibited peak Ca2+ currents at different agonist concentrations, or in 30-nM Cl-IB-MECA during coapplication with the A3AR antagonist MRS1523 (1523, 100 nM) or with the selective N-type and L-type Ca2+ channels blockers PD173212 (PD, 0.5 μM) and lacidipine (LAC, 1 μM), respectively. *P < 0.05; ***P < 0.0001 vs 30-nM Cl-IB-MECA; #P < 0.05 vs 10-nM Cl-IB-MECA, one-way ANOVA, Bonferroni posttest. (F) Left panel: time course of peak ICa evoked by a 0-mV step depolarization in a typical DRG neuron in the absence or presence of N6-cyclopentyladenosine (CPA: 1–10 μM). Right panel: original current traces recorded in the same cell at significant time points. Scale bars: 1 nA, 100 ms. ANOVA, analysis of variance; DRG, dorsal root ganglion.
Figure 7.
Figure 7.
The inhibitory effect of Cl-IB-MECA on N-type Ca2+ currents in DRG neurons is mimicked by the newly synthetized A3AR agonist MRS5980 and by adenosine. (A) Left panel: time course of peak ICa in a typical DRG neuron before and after MRS5980 (30 nM) and Cd2+ (500 μM) application. Right panel: original current traces recorded in the same cell at significant time points. Scale bars: 2 nA; 100 ms. (B) Pooled data of MRS5980-inhibited peak Ca2+ current at different agonist concentrations or in the presence of 30-nM MRS5980 + 100-nM MRS15253. One-way ANOVA; Bonferroni posttest. (C) Averaged time courses of peak ICa before or during Cl-IB-MECA (30 nM) or MRS5980 (3 nM) application. (D) Left panel: time course of peak ICa in a typical DRG neuron before and after adenosine (30 nM) and Cd2+ (500 μM) application. Right panel: original current traces recorded in the same cell at significant time points. (E) Pooled data of adenosine-inhibited peak Ca2+ currents at different agonist concentrations or in the presence of 30-μM adenosine + the A3AR antagonist MRS15253 (100 nM) or the A1AR antagonist DPCPX (500 nM). No significant difference was found between any of the experimental groups (one-way ANOVA, Bonferroni posttest). (F) Averaged time courses of peak Ca2+ current amplitude before or after adenosine (30 μM) application alone or in the presence of DPCPX (500 nM) or MRS1523 (100 nM). ANOVA, analysis of variance; DRG, dorsal root ganglion.
Figure 8.
Figure 8.
Cl-IB-MECA inhibits AP firing in DRG neurons. (A) Original AP traces evoked in a typical DRG neuron by a 1-second depolarizing ramp current injection (lower inset) recorded before (black trace) or after (red trace) 5-minute Cl-IB-MECA (100 nM) application. (B) Time course of AP number in the same cell. (C) Pooled data of AP number measured before or after 5-minute Cl-IB-MECA application in 6 cells tested. P = 0.0091, the paired Student t test. (D) Original AP traces evoked by a 1-second depolarizing ramp current injection recorded before (black trace) or after (green trace) 5-minute Cl-IB-MECA (100 nM) application in the presence of MRS1523 (100 nM). (E) Time course of AP number in the same cell. (F) Pooled data of AP number measured before or after 5-minute Cl-IB-MECA application in the presence of MRS1523 in 5 cells tested. P = 0.5809, the paired Student t test. (G) Original AP traces evoked by a 1-second depolarizing ramp current injection recorded before (black trace) or after (purple trace) 5-minute Cl-IB-MECA (100 nM) application in the presence of PD173212 (1 μM). (H) Time course of AP number in the same cell. (I) Pooled data of AP number measured before or after 5-minute Cl-IB-MECA application in the presence of PD173212 in 6 cells tested. The paired Student t test. Scale bars: 50 mV; 500 ms. (J) Comparison between the effect of Cl-IB-MECA on AP firing when applied alone (“in ctrl,” n = 6) or when applied in the presence of 1-μM PD173212 (“in PD173212,” n = 7). Treatment (Cl-IB-MECA): F(1,22) = 11.46, P = 0.0027; time (before/after): F(1,22) = 14.27, P = 0.0010; interaction: F(1,22) = 5.416, P = 0.0029; 2-way ANOVA, Bonferroni posttest. Note that there is a statistical difference (**P = 0011) between the AP number recorded before Cl-IB-MECA application in the ctrl group (“in ctrl”) or in the PD173212 group (“in PD173212”) but not between the AP number recorded after Cl-IB-MECA application in the ctrl group or in the PD173212 group (P = 0.7109). ANOVA, analysis of variance; AP, action potential; DRG, dorsal root ganglion.
Figure 9.
Figure 9.
A3 receptor stimulation reduces electrically evoked and TTX-sensitive intracellular Ca2+ transients in isolated DRG neurons. (A) Typical time courses of Ca2+ transient induce in DRG neurons by 0.1-Hz electrical field stimulation in control condition (ctrl: black trace), extracellular free-Ca2+ solution (0[Ca2+]out: dotted trace), 1-μM tetrodotoxin + 200-nM A887826 (TTX: yellow trace), or verapamil (VERA; 1 μM) + PD173212 (PD; 500 nM). (B) Time courses of spiking cells recorded in 0[Ca2+]out (dotted trace) or in TTX + A887826 (gray trace). (C) Numbers of spiking or not spiking DRG neurons in control conditions or after preincubation with 30-nM Cl-IB-MECA. Statistical analysis was performed using the χ2 test. DRG, dorsal root ganglion.

Similar articles

Cited by

References

    1. Adler JA, Lotz NM. Intrathecal pain management: a team-based approach. J Pain Res 2017;10:2565–75. - PMC - PubMed
    1. Brookes ME, Eldabe S, Batterham A. Ziconotide monotherapy: a systematic review of randomised controlled trials. Curr Neuropharmacol 2017;15:217–31. - PMC - PubMed
    1. Cai Q, Qiu CY, Qiu F, Liu TT, Qu ZW, Liu YM, Hu WP. Morphine inhibits acid-sensing ion channel currents in rat dorsal root ganglion neurons. Brain Res 2014;1554:12–20. - PubMed
    1. Coppi E, Maraula G, Fumagalli M, Failli P, Cellai L, Bonfanti E, Mazzoni L, Coppini R, Abbracchio MP, Pedata F, Pugliese AM. UDP-glucose enhances outward K plus currents necessary for cell differentiation and stimulates cell migration by activating the GPR17 receptor in oligodendrocyte precursors. Glia 2013;61:1155–71. - PubMed
    1. Coppi E, Pedata F, Gibb AJ. P2Y1 receptor modulation of Ca2+-activated K+ currents in medium-sized neurons from neonatal rat striatal slices. J Neurophysiol 2012;107:1009–21. - PMC - PubMed

Publication types

MeSH terms