

Ethanol Exposure Increases miR-140 in Extracellular Vesicles: Implications for Fetal Neural Stem Cell Proliferation and Maturation
- PMID: 31009095
- PMCID: PMC6602864
- DOI: 10.1111/acer.14066
Ethanol Exposure Increases miR-140 in Extracellular Vesicles: Implications for Fetal Neural Stem Cell Proliferation and Maturation
Abstract
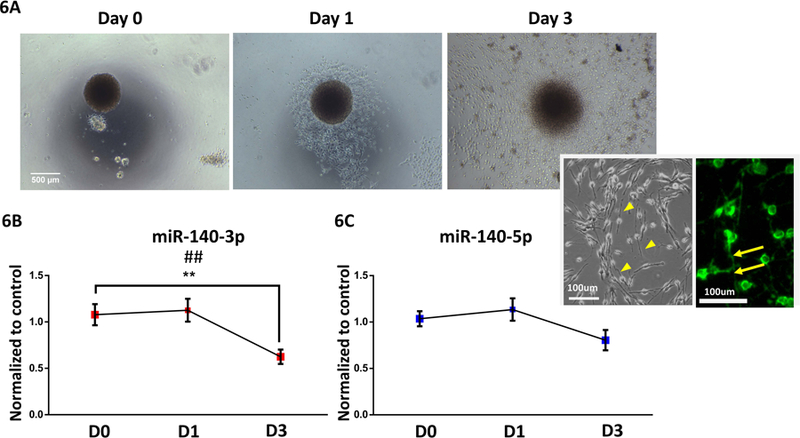
Background: Neural stem cells (NSCs) generate most of the neurons of the adult brain in humans, during the mid-first through second-trimester period. This critical neurogenic window is particularly vulnerable to prenatal alcohol exposure, which can result in diminished brain growth. Previous studies showed that ethanol (EtOH) exposure does not kill NSCs, but, rather, results in their depletion by influencing cell cycle kinetics and promoting aberrant maturation, in part, by altering NSC expression of key neurogenic miRNAs. NSCs reside in a complex microenvironment rich in extracellular vesicles, shown to traffic miRNA cargo between cells.
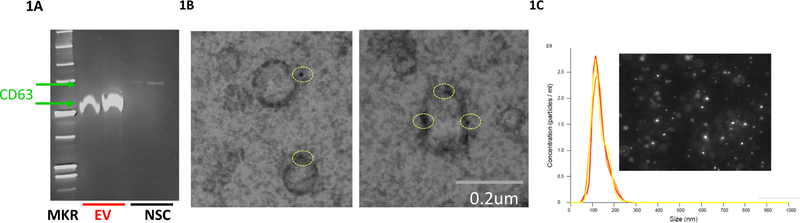
Methods: We profiled the miRNA content of extracellular vesicles from control and EtOH-exposed ex vivo neurosphere cultures of fetal NSCs. We subsequently examined the effects of one EtOH-sensitive miRNA, miR-140-3p, on NSC growth, survival, and maturation.
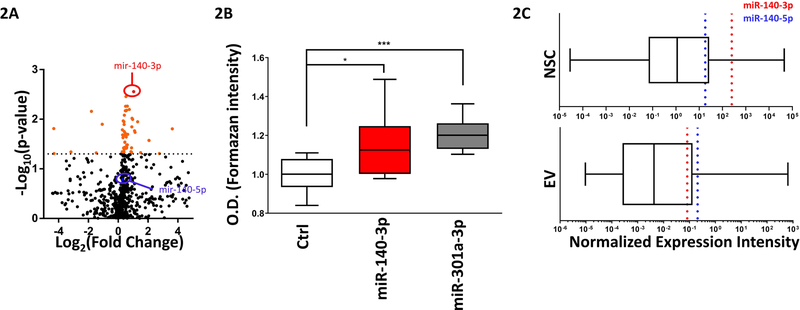
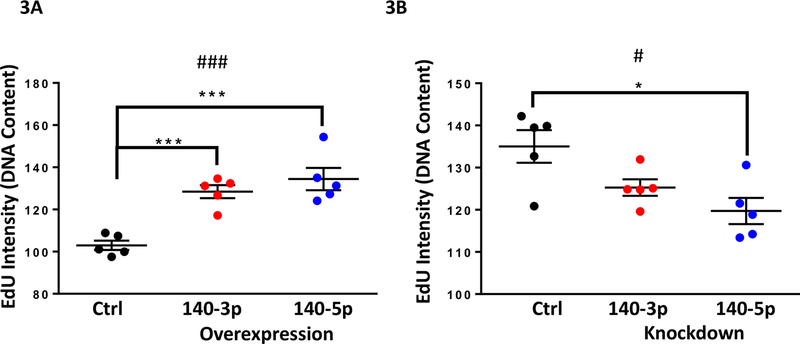
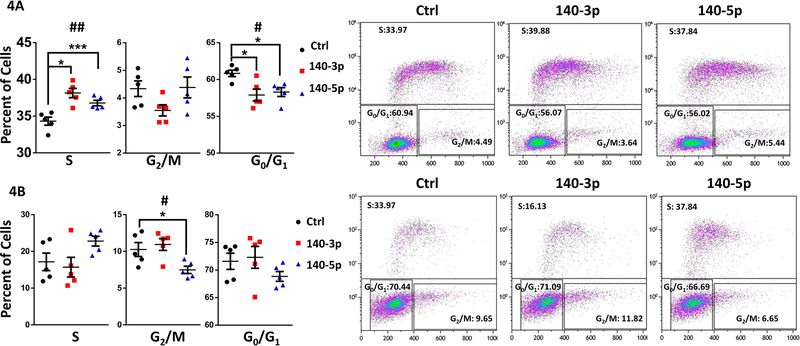
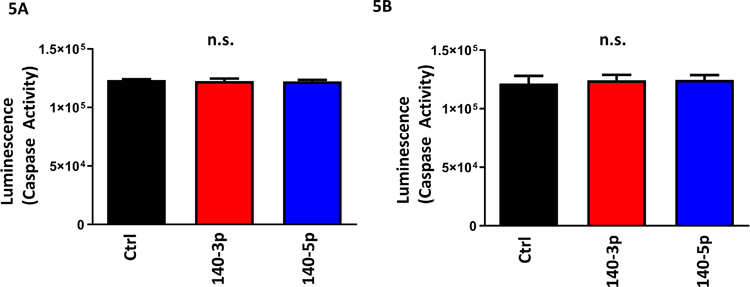
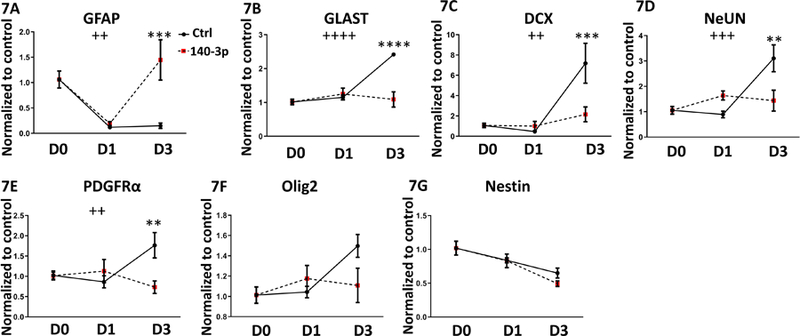
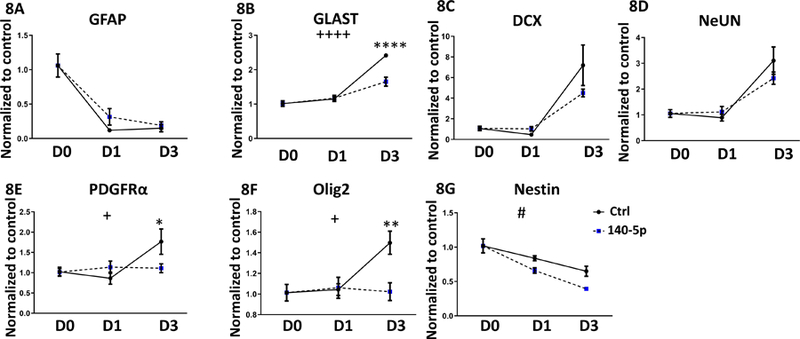
Results: EtOH exposure significantly elevates levels of a subset of miRNAs in secreted extracellular vesicles. Overexpression of one of these elevated miRNAs, miR-140-3p, and its passenger strand relative, miR-140-5p, significantly increased the proportion of S-phase cells while decreasing the proportion of G0 /G1 cells compared to controls. In contrast, while miR-140-3p knockdown had minimal effects on the proportion of cells in each phase of the cell cycle, knockdown of miR-140-5p significantly decreased the proportion of cells in G2 /M phase. Furthermore, miR-140-3p overexpression, during mitogen-withdrawal-induced NSC differentiation, favors astroglial maturation at the expense of neural and oligodendrocyte differentiation.
Conclusions: Collectively, the dysregulated miRNA content of extracellular vesicles following EtOH exposure may result in aberrant neural progenitor cell growth and maturation, explaining brain growth deficits associated with prenatal alcohol exposure.
Keywords: Exosomes; Extracellular Vesicles; Fetal Alcohol; Neural Stem Cells; microRNA.
© 2019 by the Research Society on Alcoholism.
Conflict of interest statement
Conflict of Interest Statement:
The authors declare no conflict of interest.
Figures
Similar articles
-
Sex differences in the transcriptome of extracellular vesicles secreted by fetal neural stem cells and effects of chronic alcohol exposure.Biol Sex Differ. 2023 Apr 15;14(1):19. doi: 10.1186/s13293-023-00503-0. Biol Sex Differ. 2023. PMID: 37060018 Free PMC article.
-
Opposing actions of ethanol and nicotine on microRNAs are mediated by nicotinic acetylcholine receptors in fetal cerebral cortical-derived neural progenitor cells.Alcohol Clin Exp Res. 2012 Oct;36(10):1669-77. doi: 10.1111/j.1530-0277.2012.01793.x. Epub 2012 Mar 28. Alcohol Clin Exp Res. 2012. PMID: 22458409 Free PMC article.
-
A novel Oct4/Pou5f1-like non-coding RNA controls neural maturation and mediates developmental effects of ethanol.Neurotoxicol Teratol. 2021 Jan-Feb;83:106943. doi: 10.1016/j.ntt.2020.106943. Epub 2020 Nov 20. Neurotoxicol Teratol. 2021. PMID: 33221301 Free PMC article.
-
Neural stem cell derived extracellular vesicles: Attributes and prospects for treating neurodegenerative disorders.EBioMedicine. 2018 Dec;38:273-282. doi: 10.1016/j.ebiom.2018.11.026. Epub 2018 Nov 22. EBioMedicine. 2018. PMID: 30472088 Free PMC article. Review.
-
Neural stem cell-derived small extracellular vesicles: a new therapy approach in neurological diseases.Front Immunol. 2025 Apr 16;16:1548206. doi: 10.3389/fimmu.2025.1548206. eCollection 2025. Front Immunol. 2025. PMID: 40308614 Free PMC article. Review.
Cited by
-
Dose-related shifts in proteome and function of extracellular vesicles secreted by fetal neural stem cells following chronic alcohol exposure.Heliyon. 2022 Nov 1;8(11):e11348. doi: 10.1016/j.heliyon.2022.e11348. eCollection 2022 Nov. Heliyon. 2022. PMID: 36387439 Free PMC article.
-
Sex differences in the transcriptome of extracellular vesicles secreted by fetal neural stem cells and effects of chronic alcohol exposure.Biol Sex Differ. 2023 Apr 15;14(1):19. doi: 10.1186/s13293-023-00503-0. Biol Sex Differ. 2023. PMID: 37060018 Free PMC article.
-
miR-140-5p in Small Extracellular Vesicles From Human Papilla Cells Stimulates Hair Growth by Promoting Proliferation of Outer Root Sheath and Hair Matrix Cells.Front Cell Dev Biol. 2020 Dec 14;8:593638. doi: 10.3389/fcell.2020.593638. eCollection 2020. Front Cell Dev Biol. 2020. PMID: 33425897 Free PMC article.
-
Fetal alcohol spectrum disorders.Nat Rev Dis Primers. 2023 Feb 23;9(1):11. doi: 10.1038/s41572-023-00420-x. Nat Rev Dis Primers. 2023. PMID: 36823161 Review.
-
Neural crest cells and fetal alcohol spectrum disorders: Mechanisms and potential targets for prevention.Pharmacol Res. 2023 Aug;194:106855. doi: 10.1016/j.phrs.2023.106855. Epub 2023 Jul 17. Pharmacol Res. 2023. PMID: 37460002 Free PMC article. Review.
References
-
- ACOG 2011. Committee opinion no. 496: At-risk drinking and alcohol dependence: obstetric and gynecologic implications. Obstet Gynecol, 118, 383–8. - PubMed
-
- ADACHI J, MIZOI Y, FUKUNAGA T, OGAWA Y, UENO Y & IMAMICHI H 1991. Degrees of alcohol intoxication in 117 hospitalized cases. J Stud Alcohol, 52, 448–53. - PubMed
-
- AL-NEDAWI K, MEEHAN B, MICALLEF J, LHOTAK V, MAY L, GUHA A & RAK J 2008. Intercellular transfer of the oncogenic receptor EGFRvIII by microvesicles derived from tumour cells. Nat Cell Biol, 10, 619–24. - PubMed
-
- BAGLIO SR, ROOIJERS K, KOPPERS-LALIC D, VERWEIJ FJ, PÉREZ LANZÓN M, ZINI N, NAAIJKENS B, PERUT F, NIESSEN HWM, BALDINI N & PEGTEL DM 2015. Human bone marrow- and adipose-mesenchymal stem cells secrete exosomes enriched in distinctive miRNA and tRNA species. Stem Cell Research & Therapy, 6, 127. - PMC - PubMed
Publication types
MeSH terms
Substances
Grants and funding
LinkOut - more resources
Full Text Sources
Other Literature Sources
