

Integration of Multiple Data Sources for Gene Network Inference Using Genetic Perturbation Data
- PMID: 31009236
- PMCID: PMC6786343
- DOI: 10.1089/cmb.2019.0036
Integration of Multiple Data Sources for Gene Network Inference Using Genetic Perturbation Data
Abstract
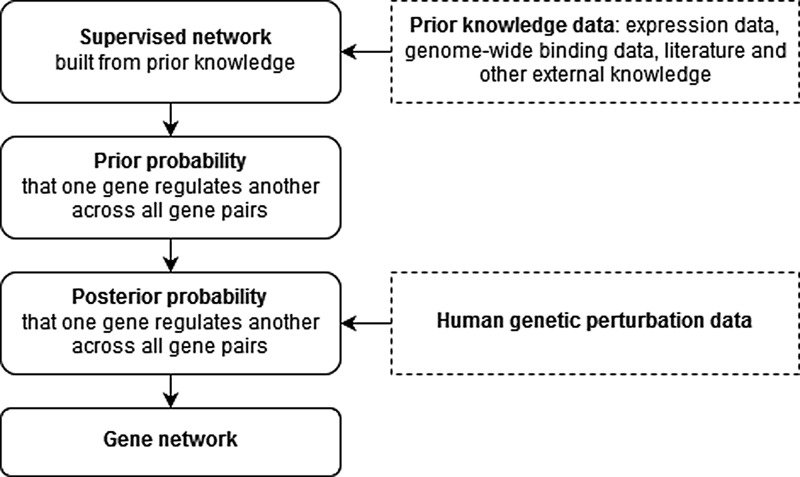
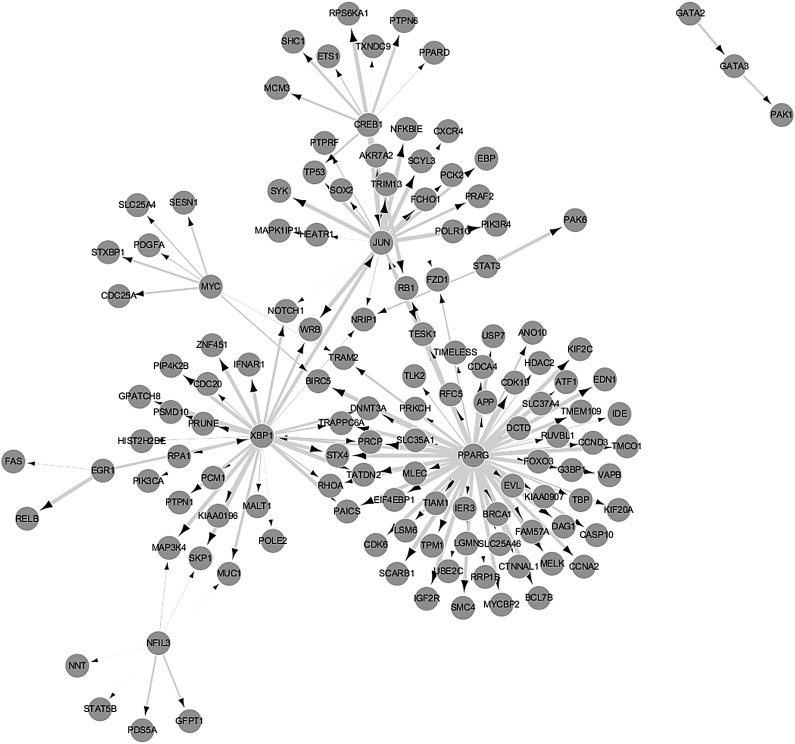
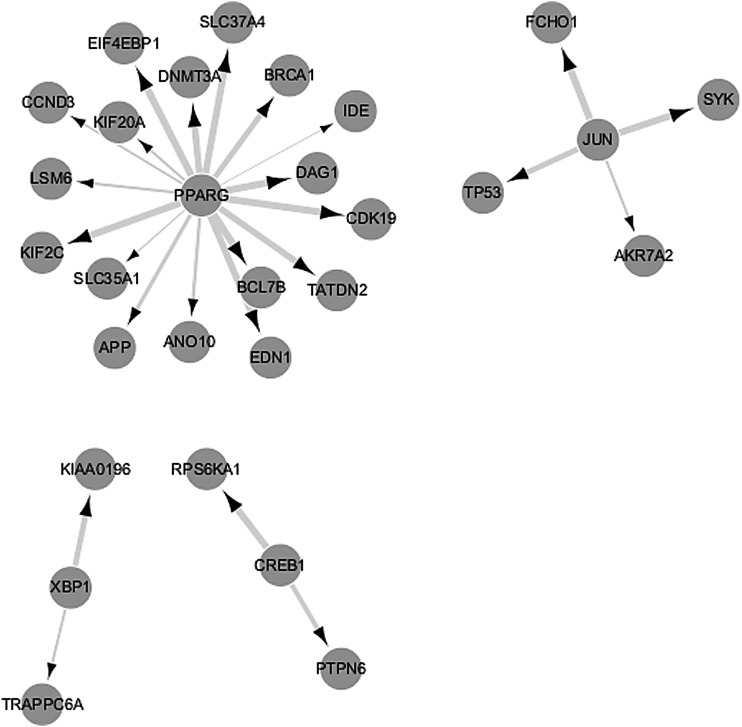
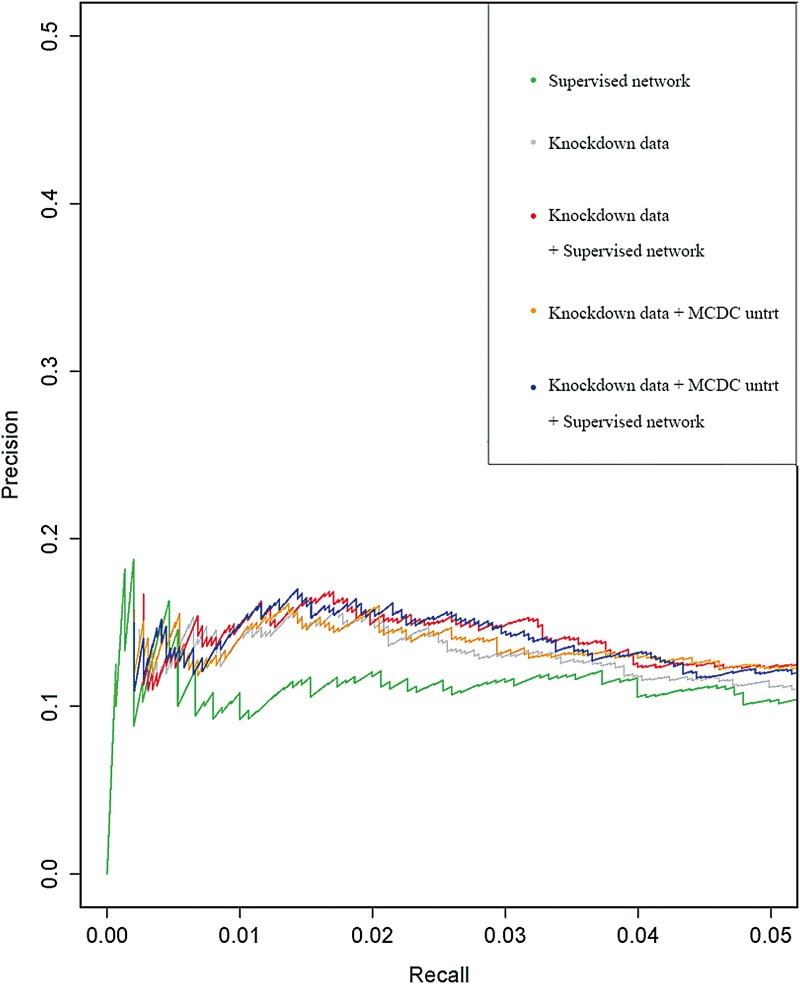
The inference of gene networks from large-scale human genomic data is challenging due to the difficulty in identifying correct regulators for each gene in a high-dimensional search space. We present a Bayesian approach integrating external data sources with knockdown data from human cell lines to infer gene regulatory networks. In particular, we assemble multiple data sources, including gene expression data, genome-wide binding data, gene ontology, and known pathways, and use a supervised learning framework to compute prior probabilities of regulatory relationships. We show that our integrated method improves the accuracy of inferred gene networks as well as extends some previous Bayesian frameworks both in theory and applications. We apply our method to two different human cell lines, namely skin melanoma cell line A375 and lung cancer cell line A549, to illustrate the capabilities of our method. Our results show that the improvement in performance could vary from cell line to cell line and that we might need to choose different external data sources serving as prior knowledge if we hope to obtain better accuracy for different cell lines.
Keywords: data integration; gene regulation; machine learning; systems biology.
Conflict of interest statement
The authors declare there are no competing financial interests.
Figures
Similar articles
-
Cell cycle gene networks are associated with melanoma prognosis.PLoS One. 2012;7(4):e34247. doi: 10.1371/journal.pone.0034247. Epub 2012 Apr 20. PLoS One. 2012. PMID: 22536322 Free PMC article.
-
Fast Bayesian inference for gene regulatory networks using ScanBMA.BMC Syst Biol. 2014 Apr 17;8:47. doi: 10.1186/1752-0509-8-47. BMC Syst Biol. 2014. PMID: 24742092 Free PMC article.
-
Integrating external biological knowledge in the construction of regulatory networks from time-series expression data.BMC Syst Biol. 2012 Aug 16;6:101. doi: 10.1186/1752-0509-6-101. BMC Syst Biol. 2012. PMID: 22898396 Free PMC article.
-
Autoregressive models for gene regulatory network inference: sparsity, stability and causality issues.Math Biosci. 2013 Dec;246(2):326-34. doi: 10.1016/j.mbs.2013.10.003. Epub 2013 Oct 28. Math Biosci. 2013. PMID: 24176667 Review.
-
Bayesian Computation Methods for Inferring Regulatory Network Models Using Biomedical Data.Adv Exp Med Biol. 2016;939:289-307. doi: 10.1007/978-981-10-1503-8_12. Adv Exp Med Biol. 2016. PMID: 27807752 Review.
Cited by
-
Drug target inference by mining transcriptional data using a novel graph convolutional network framework.Protein Cell. 2022 Apr;13(4):281-301. doi: 10.1007/s13238-021-00885-0. Epub 2021 Oct 22. Protein Cell. 2022. PMID: 34677780 Free PMC article.
-
Network inference in systems biology: recent developments, challenges, and applications.Curr Opin Biotechnol. 2020 Jun;63:89-98. doi: 10.1016/j.copbio.2019.12.002. Epub 2020 Jan 9. Curr Opin Biotechnol. 2020. PMID: 31927423 Free PMC article. Review.
-
Deep learning-based multimodal spatial transcriptomics analysis for cancer.Adv Cancer Res. 2024;163:1-38. doi: 10.1016/bs.acr.2024.08.001. Epub 2024 Aug 22. Adv Cancer Res. 2024. PMID: 39271260 Free PMC article. Review.
References
-
- ada package 2016. Available at: cran.r-project.org/package=ada Accessed February28, 2017
-
- Banfield J.D., and Raftery A.E. 1993. Model-based gaussian and non-gaussian clustering. Biometrics 49, 803–821
-
- Bansal M., Della Gatta G., and Di Bernardo D. 2006. Inference of gene regulatory networks and compound mode of action from time course gene expression profiles. Bioinformatics 22, 815–822 - PubMed
Publication types
MeSH terms
Grants and funding
LinkOut - more resources
Full Text Sources
