

Environmental Styrene Exposure and Sensory and Motor Function in Gulf Coast Residents
- PMID: 31009265
- PMCID: PMC6785236
- DOI: 10.1289/EHP3954
Environmental Styrene Exposure and Sensory and Motor Function in Gulf Coast Residents
Abstract
Background: Although styrene is an established neurotoxicant at occupational exposure levels, its neurotoxicity has not been characterized in relation to general population exposures. Further, occupational research to date has focused on central nervous system impairment.
Objective: We assessed styrene-associated differences in sensory and motor function among Gulf coast residents.
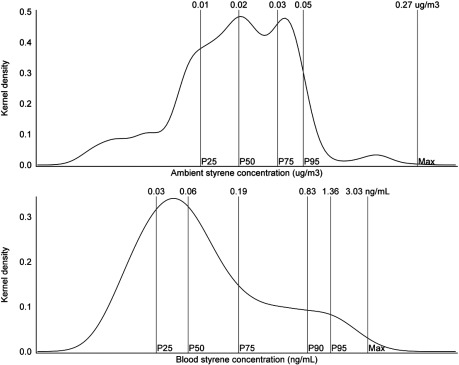
Methods: We used 2011 National Air Toxics Assessment estimates of ambient styrene to determine exposure levels for 2,956 nondiabetic Gulf state residents enrolled in the Gulf Long-term Follow-up Study, and additionally measured blood styrene concentration in a subset of participants 1 to 2 y after enrollment ([Formula: see text]). Participants completed an enrollment telephone interview and a comprehensive test battery to assess sensory and motor function during a clinical follow-up exam 2 to 4 y later. Detailed covariate information was ascertained at enrollment via telephone interview. We used multivariate linear regression to estimate continuous differences in sensory and motor function, and log-binomial regression to estimate prevalence ratios for dichotomous outcomes. We estimated associations of both ambient and blood styrene exposures with sensory and motor function, independently for five unique tests.
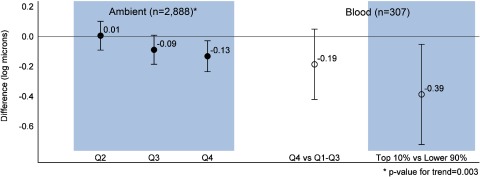
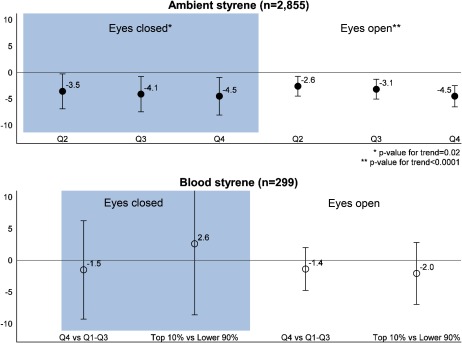
Results: Those participants in the highest 25% vs. lowest 75% of ambient exposure and those in the highest 10% vs. lowest 90% of blood styrene had slightly diminished visual contrast sensitivity. Mean vibrotactile thresholds were lower among those in the highest vs. lowest quartile of ambient styrene and the highest 10% vs. lowest 90% of blood styrene ([Formula: see text] log microns; 95% CI: [Formula: see text], [Formula: see text] and [Formula: see text] log microns; 95% CI: [Formula: see text], [Formula: see text], respectively). The highest vs. lowest quartile of ambient styrene was associated with significantly poorer postural stability, and (unexpectedly) with significantly greater grip strength.
Discussion: We observed associations between higher styrene exposure and poorer visual, sensory, and vestibular function, though we did not detect associations with reduced voluntary motor system performance. Associations were more consistent for ambient exposures, but we also found notable associations with measured blood styrene. https://doi.org/10.1289/EHP3954.
Figures
Similar articles
-
Environmental styrene exposure and neurologic symptoms in U.S. Gulf coast residents.Environ Int. 2018 Dec;121(Pt 1):480-490. doi: 10.1016/j.envint.2018.09.025. Epub 2018 Oct 1. Environ Int. 2018. PMID: 30278311 Free PMC article.
-
Long-Term Exposure to Ambient Ozone and Progression of Subclinical Arterial Disease: The Multi-Ethnic Study of Atherosclerosis and Air Pollution.Environ Health Perspect. 2019 May;127(5):57001. doi: 10.1289/EHP3325. Environ Health Perspect. 2019. PMID: 31063398 Free PMC article.
-
Long-Term Exposure to Ambient Fine Particulate Matter and Chronic Kidney Disease: A Cohort Study.Environ Health Perspect. 2018 Oct;126(10):107002. doi: 10.1289/EHP3304. Environ Health Perspect. 2018. PMID: 30392394 Free PMC article.
-
Long-Term Exposure to Ultrafine Particles and Incidence of Cardiovascular and Cerebrovascular Disease in a Prospective Study of a Dutch Cohort.Environ Health Perspect. 2018 Dec;126(12):127007. doi: 10.1289/EHP3047. Environ Health Perspect. 2018. PMID: 30566375 Free PMC article.
-
Environmental Chemicals and Autism: A Scoping Review of the Human and Animal Research.Environ Health Perspect. 2019 Apr;127(4):46001. doi: 10.1289/EHP4386. Environ Health Perspect. 2019. PMID: 30942615 Free PMC article.
Cited by
-
Association between spill-related exposure to fine particulate matter and peripheral motor and sensory nerve function among oil spill response and cleanup workers following the Deepwater Horizon oil spill.J Expo Sci Environ Epidemiol. 2024 May;34(3):496-504. doi: 10.1038/s41370-023-00558-6. Epub 2023 Jul 13. J Expo Sci Environ Epidemiol. 2024. PMID: 37443296 Free PMC article.
-
Evaluation of Bayesian Maximum Entropy Data Fusion Approaches to Estimate Styrene, Benzene, Toluene, Ethylbenzene, and Xylenes and to Inform Epidemiological Analyses in the US Gulf States.Environ Sci Technol. 2025 Jan 14;59(1):45-55. doi: 10.1021/acs.est.4c05094. Epub 2025 Jan 3. Environ Sci Technol. 2025. PMID: 39754299
-
Concentrations of blood styrene and neurobehavioral function among Gulf state residents in the U.S.Int J Environ Health Res. 2025 Feb 12:1-13. doi: 10.1080/09603123.2025.2464086. Online ahead of print. Int J Environ Health Res. 2025. PMID: 39936180
-
Air Quality Dispersion Modelling to Evaluate CIPP Installation Styrene Emissions.Int J Environ Res Public Health. 2022 Oct 24;19(21):13800. doi: 10.3390/ijerph192113800. Int J Environ Res Public Health. 2022. PMID: 36360679 Free PMC article.
-
Fine particulate matter from burning oil and gas and associated neurological symptoms among Deepwater Horizon oil spill cleanup workers.Environ Sci Process Impacts. 2025 Feb 19;27(2):423-436. doi: 10.1039/d4em00469h. Environ Sci Process Impacts. 2025. PMID: 39815820 Free PMC article.
References
-
- Ashley DL, Bonin MA, Cardinali FL, McCraw JM, Wooten JV. 1994. Blood concentrations of volatile organic compounds in a nonoccupationally exposed US population and in groups with suspected exposure. Clin Chem 40:1401–1404, PMID: 8013127. - PubMed
-
- ATSDR (Agency for Toxic Substances and Disease Registry). 2010. Toxicological Profile for Styrene. Atlanta, GA: Centers for Disease Control and Prevention. - PubMed
-
- ATSDR. 2011. Toxguide for Styrene. Atlanta, GA: Centers for Disease Control and Prevention.
-
- ATSDR. 2012. Division of Toxicology and Human Health Sciences Toxfaqs: Styrene. Atlanta, GA: Centers for Disease Control and Prevention.
-
- Batterman S, Su F-C, Li S, Mukherjee B, Jia C. 2014. Personal exposure to mixtures of volatile organic compounds: Modeling and further analysis of the RIOPA data. Research Report 181. Boston, MA: Health Effects Institute; https://www.healtheffects.org/publication/personal-exposure-mixtures-vol... [accessed 29 August 2015]. - PMC - PubMed
Publication types
MeSH terms
Substances
Grants and funding
LinkOut - more resources
Full Text Sources
