. 2019 Apr 22;15(4):e1008091.
doi: 10.1371/journal.pgen.1008091. eCollection 2019 Apr.

Expression estimation and eQTL mapping for HLA genes with a personalized pipeline

Affiliations

Expression estimation and eQTL mapping for HLA genes with a personalized pipeline

Vitor R C Aguiar et al. PLoS Genet. .

Abstract

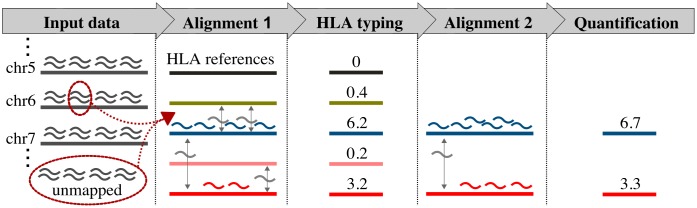
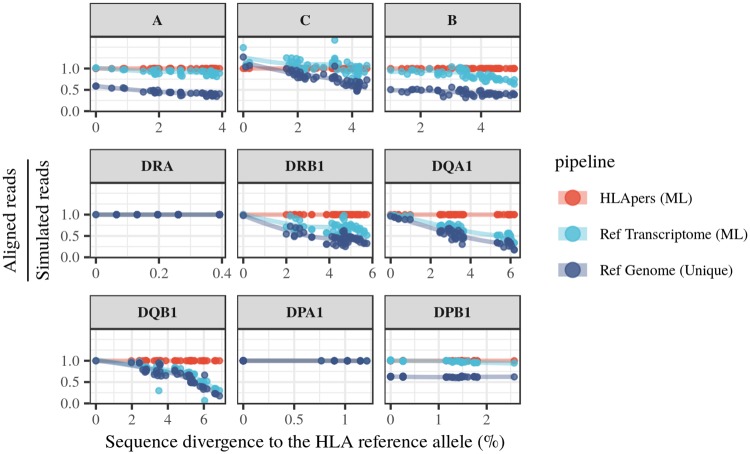
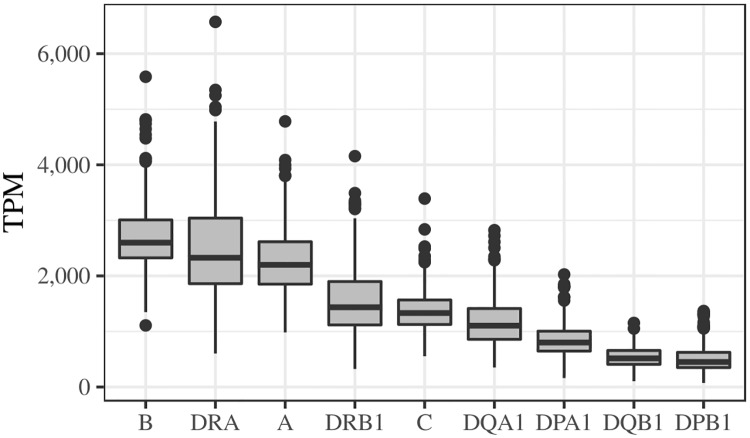
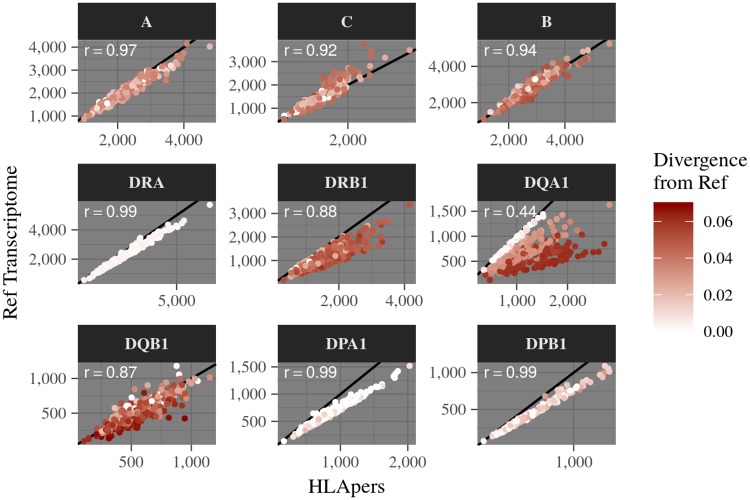
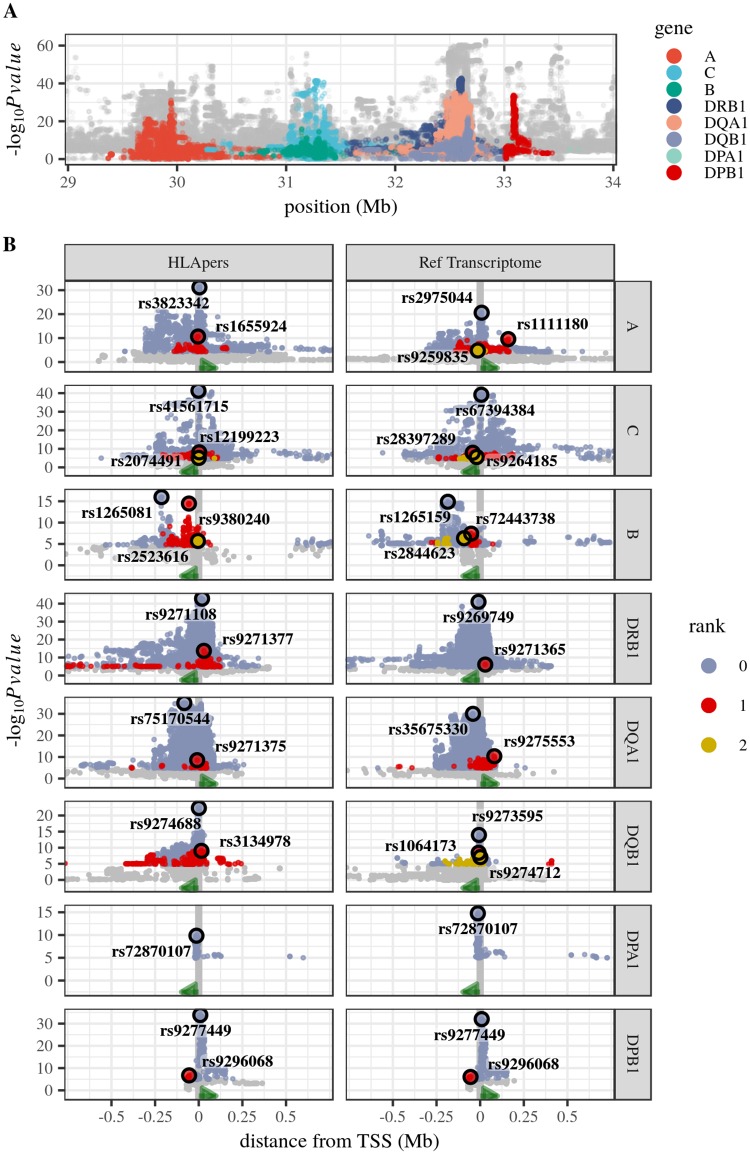
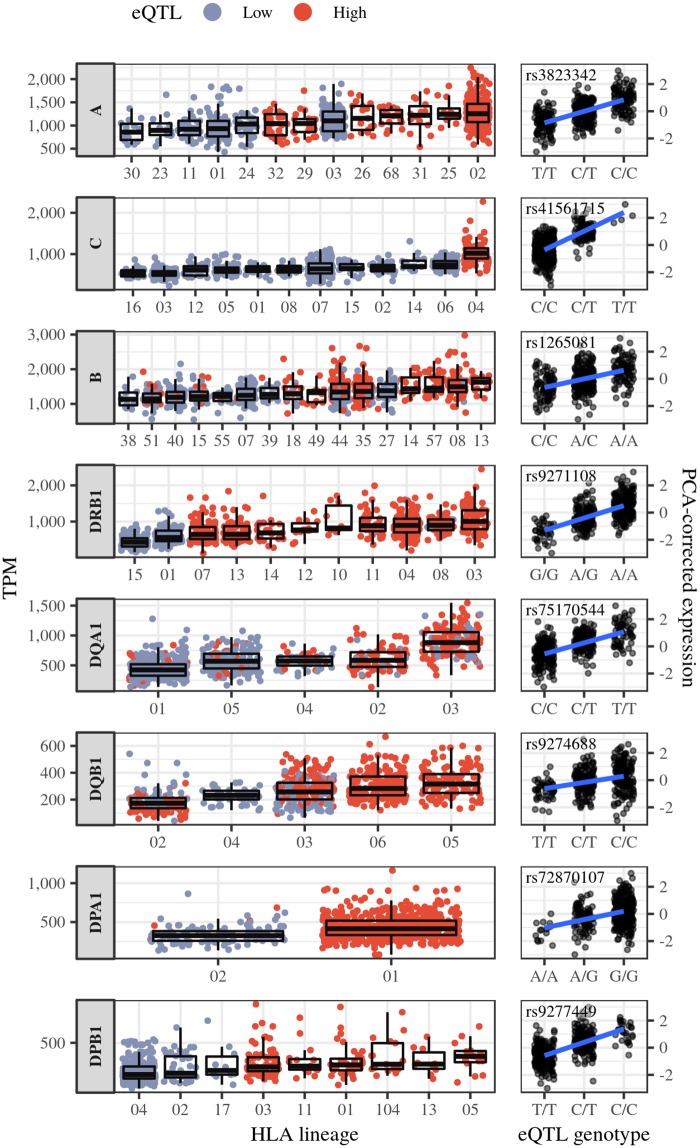
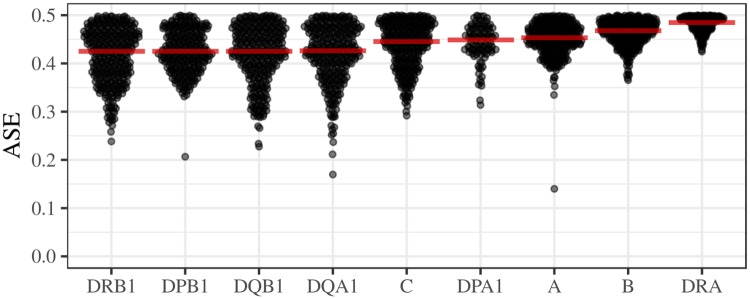
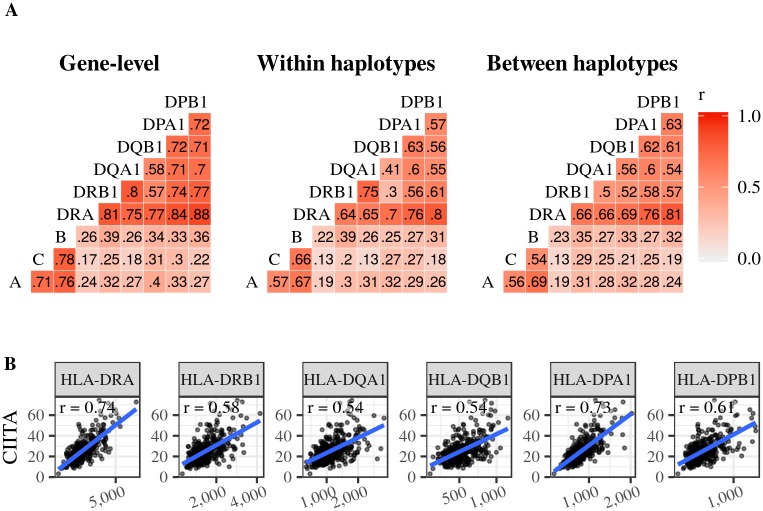
The HLA (Human Leukocyte Antigens) genes are well-documented targets of balancing selection, and variation at these loci is associated with many disease phenotypes. Variation in expression levels also influences disease susceptibility and resistance, but little information exists about the regulation and population-level patterns of expression. This results from the difficulty in mapping short reads originated from these highly polymorphic loci, and in accounting for the existence of several paralogues. We developed a computational pipeline to accurately estimate expression for HLA genes based on RNA-seq, improving both locus-level and allele-level estimates. First, reads are aligned to all known HLA sequences in order to infer HLA genotypes, then quantification of expression is carried out using a personalized index. We use simulations to show that expression estimates obtained in this way are not biased due to divergence from the reference genome. We applied our pipeline to the GEUVADIS dataset, and compared the quantifications to those obtained with reference transcriptome. Although the personalized pipeline recovers more reads, we found that using the reference transcriptome produces estimates similar to the personalized pipeline (r ≥ 0.87) with the exception of HLA-DQA1. We describe the impact of the HLA-personalized approach on downstream analyses for nine classical HLA loci (HLA-A, HLA-C, HLA-B, HLA-DRA, HLA-DRB1, HLA-DQA1, HLA-DQB1, HLA-DPA1, HLA-DPB1). Although the influence of the HLA-personalized approach is modest for eQTL mapping, the p-values and the causality of the eQTLs obtained are better than when the reference transcriptome is used. We investigate how the eQTLs we identified explain variation in expression among lineages of HLA alleles. Finally, we discuss possible causes underlying differences between expression estimates obtained using RNA-seq, antibody-based approaches and qPCR.


Conflict of interest statement

The authors have declared that no competing interests exist.

Figures

Fig 1
Fig 1. Schematic representation of the HLApers pipeline to estimate HLA expression.
The reads generated by RNA-seq are represented by curved shapes. The pipeline can use as input either reads in fastq format or extracted from a BAM file (Input data). These reads are aligned to an index containing references for all known HLA alleles (Alignment 1). We next identify the references to which most reads align, so as to infer the HLA genotypes of the individual at that locus, in this example a heterozygote carrying a blue and a red allele (HLA typing). Next, a second alignment is performed, using as an index only the references for the alleles inferred to be present in that individual at that locus (Alignment 2). Expression is estimated based on the number of reads aligning to each reference, using a statistical model that accounts for instances where reads align to multiple HLA references corresponding to different HLA alleles or genes (Quantification). For each HLA allele, the quantification corresponds to the proportion of the total reads assigned by the statistical model.
Fig 2
Fig 2. Alignment success with three different methodologies.
The proportion of simulated reads which successfully aligned is defined for each locus by the ratio of the estimated read counts to the number of simulated reads (y-axis). These values are displayed as a function of the divergence of the HLA allele to the reference genome (x-axis). Simulated reads were processed through 3 different pipelines: (1) alignment to the personalized HLA sequences (HLApers (ML)), (2) alignment to the reference transcriptome (Ref Transcriptome (ML)), (3) alignment to the reference genome considering only uniquely mapped reads (Ref Genome (Unique)).
Fig 3
Fig 3. Gene-level expression of classical HLA genes in 358 European individuals from GEUVADIS [24].
Expression was estimated with the HLApers pipeline. Horizontal lines inside each box represent the median. The lower and upper hinges correspond to the first and third quartiles respectively. The whisker lines extend from the hinges to the largest value no further than ±1.5 × IQR from the hinge (where IQR is the inter-quartile range, or distance between the first and third quartiles). Data beyond the end of the whiskers (“outliers”) are plotted individually. TPM: Transcripts per Million.
Fig 4
Fig 4. Expression estimates using personalized HLA genotypes (x-axis) versus the reference transcriptome (y-axis) in the index.
For each individual we identify the average divergence (proportion of mismatches) with respect to the reference genome, indicated by the red gradient. For all loci with low correlations between expression quantification methods, there is a marked drop in expression estimates using the reference transcriptome when the alleles are most divergent from the reference. Expression estimates are in Transcripts per Million (TPM). r: Pearson correlation coefficient.
Fig 5
Fig 5. eQTLs for HLA loci.
A: Distribution of p-values for the association between genotypic and expression variation along the HLA region, colored by gene. B: Distribution of p-values around the transcription start site (TSS, vertical line at x = 0), for eQTLs mapped with HLApers or reference transcriptome pipelines. Points are colored according to the rank of association (with gray for non-significant associations at an FDR of 5%). The best eQTL of each rank is circled in black. Green arrows indicate the orientation of transcription. There was no eQTL mapped for HLA-DRA.
Fig 6
Fig 6. Expression levels for different HLA lineages and eQTL genotypes.
For each locus panel we have: (left-hand side) expression estimates for each HLA allele in Transcripts per Million (TPM), and (right-hand side) gene-level estimates for each eQTL genotype in PCA-normalized estimates used for eQTL mapping. Allelic lineages with ≥ 10 individuals are shown.
Fig 7
Fig 7. Allele-specific expression.
ASE was measured as the proportion of the locus-level expression attributed to the less expressed HLA allele in heterozygous genotypes. Red horizontal bars indicate the median.
Fig 8
Fig 8. Co-expression patterns for HLA genes.
A: Pairwise correlation of expression estimates at the gene-level, for alleles from within the same haplotype, and for alleles on different haplotypes. B: An example of a factor that contributes to correlation of expression at the gene level. CIITA is located on chromosome 16, and its protein regulates the expression of Class II genes. r: Pearson correlation coefficient.

References

    1. Horton R, Wilming L, Rand V, Lovering R, Bruford E, Khodiyar V, et al. Gene map of the extended human MHC. Nature Reviews Genetics. 2004;5(12):889–899. 10.1038/nrg1489 - DOI - PubMed
    1. Trowsdale J, Knight J. Major histocompatibility complex genomics and human disease. The Annual Review of Genomics and Human Genetics. 2013;14:301–323. 10.1146/annurev-genom-091212-153455 - DOI - PMC - PubMed
    1. Meyer D, Thomson G. How selection shapes variation of the human major histocompatibility complex: a review. Annals of Human Genetics. 2001;65(01):1–26. 10.1046/j.1469-1809.2001.6510001.x - DOI - PubMed
    1. Meyer D, Single R, Mack S, Lancaster A, Nelson M, Erlich H, et al. Single locus polymorphism of classical HLA genes. In: Hansen JA Immunobiology of the Human MHC: Proceedings of the 13th International Histocompatibility Workshop and Conference. Seattle, WA: IHWG Press; 2007. p. 653–704.
    1. Erlich R, Jia X, Anderson S, Banks E, Gao X, Carrington M, et al. Next-generation sequencing for HLA typing of class I loci. BMC Genomics. 2011;12(42):1–13. 10.1186/1471-2164-12-42 - DOI - PMC - PubMed

Publication types