. 2019 Apr 22;15(4):e1006943.
doi: 10.1371/journal.pcbi.1006943. eCollection 2019 Apr.

Isolating and quantifying the role of developmental noise in generating phenotypic variation

Affiliations

Isolating and quantifying the role of developmental noise in generating phenotypic variation

Maria Kiskowski et al. PLoS Comput Biol. .

Abstract

Genotypic variation, environmental variation, and their interaction may produce variation in the developmental process and cause phenotypic differences among individuals. Developmental noise, which arises during development from stochasticity in cellular and molecular processes when genotype and environment are fixed, also contributes to phenotypic variation. While evolutionary biology has long focused on teasing apart the relative contribution of genes and environment to phenotypic variation, our understanding of the role of developmental noise has lagged due to technical difficulties in directly measuring the contribution of developmental noise. The influence of developmental noise is likely underestimated in studies of phenotypic variation due to intrinsic mechanisms within organisms that stabilize phenotypes and decrease variation. Since we are just beginning to appreciate the extent to which phenotypic variation due to stochasticity is potentially adaptive, the contribution of developmental noise to phenotypic variation must be separated and measured to fully understand its role in evolution. Here, we show that variation in the component of the developmental process corresponding to environmental and genetic factors (here treated together as a unit called the LALI-type) versus the contribution of developmental noise, can be distinguished for leopard gecko (Eublepharis macularius) head color patterns using mathematical simulations that model the role of random variation (corresponding to developmental noise) in patterning. Specifically, we modified the parameters of simulations corresponding to variation in the LALI-type to generate the full range of phenotypic variation in color pattern seen on the heads of eight leopard geckos. We observed that over the range of these parameters, variation in color pattern due to LALI-type variation exceeds that due to developmental noise in the studied gecko cohort. However, the effect of developmental noise on patterning is also substantial. Our approach addresses one of the major goals of evolutionary biology: to quantify the role of stochasticity in shaping phenotypic variation.


Conflict of interest statement

The authors have declared that no competing interests exist.

Figures

Fig 1
Fig 1. Ontogenetic pattern change in the leopard gecko (Eublepharis macularius).
Each photographed individual represents the typical color and pattern of a (A) hatchling (one month old), (B) juvenile (three months old), and (C) adult (>12 months old) gecko. Relative sizes are approximate, and the hatchling image has been enlarged to allow an easier comparison of pattern detail among individuals. Pictures by T. Gamble.
Fig 2
Fig 2. Conceptual model of the LALI-type to phenotype map.
The LALI-type summarizes the genetic and environmental factors of a LALI pattern. The phenotype is a product of the LALI-type and stochastic effects (random variation called developmental noise).
Fig 3
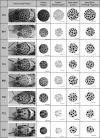
Fig 3. Automated disk-shaped pattern selection of parietal, post-orbital head region of eight geckos at nine weeks.
For each Gecko ID (numbers on the left): Left: Images of the eight gecko heads at nine weeks; Second column: the disk-shaped parietal, post-orbital (DSPPO) region that was selected for pattern analysis, preserving their relative sizes; Third column: Final pigment pattern identified by image analysis with the skeletonization of the image overlaid. Fourth column: Best phenotype match of 100 patterns simulated by the corresponding LALI-type using the linear model. Right: Best phenotype match of 100 patterns simulated by the corresponding LALI-type using the FitzHugh-Nagumo model. Horizontal bars indicate 0.5 cm. Geckos are ordered by decreasing fractional spot area of the pattern (see Table 2 for definitions). Note that in some cases in the nonlinear model, the spots have a ‘ringed’ appearance. This is the result of morphogen profiles that have a maximum concentration around the border of the spots. We note that the lack of pigment in the interior is contingent upon finely tuned threshold values, which means that the robustness of these patterns to perturbations of the sensing mechanism of the cells is likely quite weak. Our search algorithm identifies sets of parameters that yield matches to specified pattern statistics (here, fractional area and eccentricity). While the algorithm may find that finely tuned thresholds give the best match, in future applications, additional prescriptions can be applied for a match such as requiring that the pattern matches are robust to small percent perturbations or that spots do not have interior holes.
Fig 4
Fig 4. Overview of methods (Steps 0–2).
The L→P map is modeled by one of two computational reaction diffusion models. Due to developmental noise, one LALI-type probabilistically maps to many phenotypes (the ‘phenotype cloud’) and many LALI-types map to one phenotype (the ‘neutral region’ of the phenotype).
Fig 5
Fig 5. Spot statistics for each Gecko ID.
For each binarized image of spot patterning, A) fractional spot area, B) mean spot eccentricity, C) mean spot size and D) wavelength calculated by peak length (black) and Fourier (gray) methods were calculated. Geckos are ordered by decreasing fractional area. Error bars show the minimum and maximum measures of these measures as the threshold for binarization was varied by 0.1σi where σi is the standard deviation of the image pixel intensity.
Fig 6
Fig 6. Location of the eight gecko patterns in FA-EE phenotype space.
The distribution of the eight patterns in [FA,EE] phenotype space where FA is the fractional area of spots and EE is the average eccentricity of the spots.
Fig 7
Fig 7. Random phenotype variation.
The phenotype cloud for 1000 simulations showing the random variation of a single LALI-type, for either the A) linear or B) FitzHugh-Nagumo models. The representative LALI-type was chosen from the 50% neutral region of gecko pattern #682. (The location of this LALI-type is shown as a labeled white dot in Fig 8). The phenotypes of the 1000 simulations are indicated as gray disks in FA-EE phenotype space, while the 500 within the 50% radius of the phenotype cloud are outlined in purple. Three random phenotypes from the cloud are shown in red (see below). C, D) The pattern isolated from the image of Gecko #682 and the patterns of three simulated “clones” (patterns generated with the same LALI-type that is likely to yield pattern #682, but allowing random variation). The result is not necessarily ‘close’ to the pattern #682 (their locations in FA-EE space are indicated in red in the panels ‘A’ and ‘B’.) Horizontal bars indicate 0.5 cm.
Fig 8
Fig 8. 50% Neutral regions of each of the eight gecko patterns in LALI-space.
For each of the eight gecko patterns, we identified the neutral region A) in [T^,fu]-LALI-space for the linear Turing implementation or B) in [T,ρ] LALI-space for the non-linear FitzHugh-Nagumo model. The white circle in each neutral region shows the LALI-type chosen to generate representative phenotype clouds in Fig 7 and Fig 10. The labeled stars A and B are the points in LALI-space that are used to generate the “preternatural” patterns in Fig 12. (Both models used the 50% phenotype cloud to generate the 50% neutral region, see the description under “Step 2” in the Methods).
Fig 9
Fig 9. Bias of the LALI-space to phenotype space mapping.
A regular grid containing points from the neutral regions of the eight gecko patterns is chosen and the mapping of that grid to phenotype space is shown. A rectangular grid A) in [T,fu]-LALI-space for the linear Turing implementation or C) in T,ρ LALI-space for the non-linear FitzHugh-Nagumo model and the mapping of that grid in FA-EE-space for the B) linear Turing map and D) the non-linear FitzHugh-Nagumo model. The gray region indicates 25% of the area in LALI-space, which maps to a smaller fractional area in phenotype space. This corresponds to a higher likelihood of points (a higher density) in that region of phenotype space.
Fig 10
Fig 10
The Intra-Group Variation of the Eight Leopard Gecko Pattern is Larger than Random Variation Each closed curve shows the outer contour of the 95% phenotype cloud for eight LALI-types that were selected from within the neutral region of each leopard gecko pattern for the A) linear Turing and B) FitzHugh-Nagumo models. These LALI-types are indicated in LALI-space as labeled white dots in Fig 8. Although the phenotype clouds overlap, even the largest phenotype clouds do not contain all of the phenotype variation of the group, indicating that the random variation is not large enough on its own to account for all of the variation.
Fig 11
Fig 11. Classification of the relatedness of pairs of phenotypes.
Pairs of the geckos IDs 681, 682, 732, 763, 731, 773, 735, 772 are classified according to a measure of relatedness based on the linear and FitzHugh-Nagumo models used in this paper. The main idea of this measure is whether a likely combination of genotype and environmental factors for the head patterning of one of the geckos in a pair can also produce the pattern of the other gecko with developmental noise as the only difference. The darker the color, the closer two patterns are related in this sense, with white color corresponding to the case when neither of the two patterns can be produced by the other’s combination of genetic and environmental factors for any of the models. (See text for the method used to produce the table).
Fig 12
Fig 12. Preternatural’ Patterns (Patterns extending beyond the variation observed in the gecko cohort) The LALI framework can be used to generate patterns that are “nearby” in LALI-space, possibly corresponding to the patterns that could be reached by evolutionary change.
‘ For each of the ‘starred’ locations in LALI-space indicated in Fig 8, Panel A, we show three random phenotype variations corresponding to that point in LALI-space. These were generated using the linear Turing model. The fu,T LALI-type for the patterns generated in A and B are [0.805 1.0] and [0.835 1.0], respectively. Horizontal bars indicate 0.5 cm.

Similar articles

Cited by

References

    1. Gartner K., A third component causing random variability beside environment and genotype. A reason for the limited success of a 30 year long effort to standardize laboratory animals? Lab Anim, 1990. 24(1): p. 71–7. 10.1258/002367790780890347 - DOI - PubMed
    1. Peaston A.E. and Whitelaw E., Epigenetics and phenotypic variation in mammals. Mamm Genome, 2006. 17(5): p. 365–74. 10.1007/s00335-005-0180-2 - DOI - PMC - PubMed
    1. Veitia R.A., Stochasticity or the fatal 'imperfection' of cloning. J Biosci, 2005. 30(1): p. 21–30. - PubMed
    1. Vogt G., Stochastic developmental variation, an epigenetic source of phenotypic diversity with far-reaching biological consequences. Journal of Biosciences, 2015. 40(1): p. 159–204. - PubMed
    1. Ziv N., et al., Resolving the Complex Genetic Basis of Phenotypic Variation and Variability of Cellular Growth. Genetics, 2017. 206(3): p. 1645–1657. 10.1534/genetics.116.195180 - DOI - PMC - PubMed

Publication types