. 2019 Apr 22;15(4):e1007002.
doi: 10.1371/journal.pcbi.1007002. eCollection 2019 Apr.

Neural crest streaming as an emergent property of tissue interactions during morphogenesis

Affiliations

Neural crest streaming as an emergent property of tissue interactions during morphogenesis

András Szabó et al. PLoS Comput Biol. .

Abstract

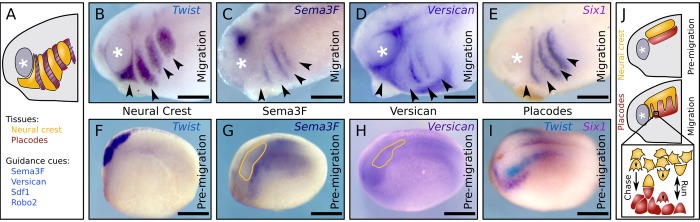
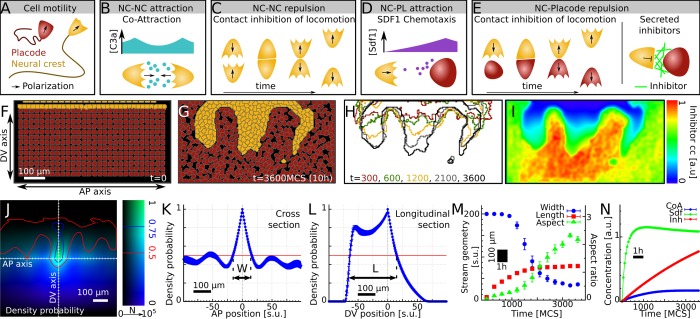
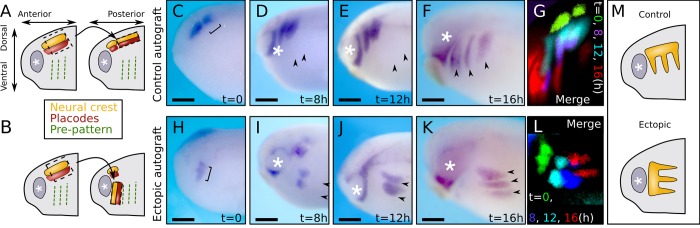
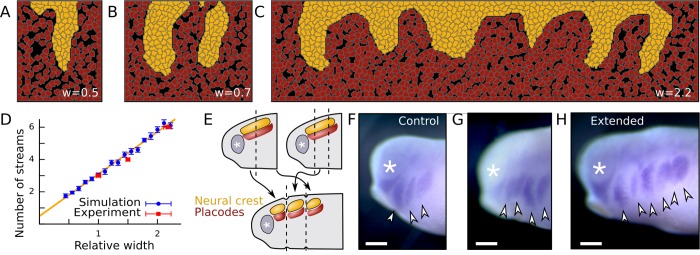
A fundamental question in embryo morphogenesis is how a complex pattern is established in seemingly uniform tissues. During vertebrate development, neural crest cells differentiate as a continuous mass of tissue along the neural tube and subsequently split into spatially distinct migratory streams to invade the rest of the embryo. How these streams are established is not well understood. Inhibitory signals surrounding the migratory streams led to the idea that position and size of streams are determined by a pre-pattern of such signals. While clear evidence for a pre-pattern in the cranial region is still lacking, all computational models of neural crest migration published so far have assumed a pre-pattern of negative signals that channel the neural crest into streams. Here we test the hypothesis that instead of following a pre-existing pattern, the cranial neural crest creates their own migratory pathway by interacting with the surrounding tissue. By combining theoretical modeling with experimentation, we show that streams emerge from the interaction of the hindbrain neural crest and the neighboring epibranchial placodal tissues, without the need for a pre-existing guidance cue. Our model suggests that the initial collective neural crest invasion is based on short-range repulsion and asymmetric attraction between neighboring tissues. The model provides a coherent explanation for the formation of cranial neural crest streams in concert with previously reported findings and our new in vivo observations. Our results point to a general mechanism of inducing collective invasion patterns.


Conflict of interest statement

The authors have declared that no competing interests exist.

Figures

Fig 1
Fig 1. The neural crest and its surroundings before and during migration.
(A) Cranial neural crest (NC) migrates in streams that are flanked by a variety of essential guidance cues corresponding with the epibranchial placodes. (B) Lateral view of Xenopus laevis embryo showing migrating NC by in situ hybridization (ISH) against Twist. (C-E) ISH showing expression of NC inhibitors Semaphorin 3F (C) and Versican (D), and the coinciding placodal cell pattern (E, Six1) during NC migration. (F-I) ISH showing pre-migratory NC, inhibitor expressions, and placode distribution before NC migration. Yellow outline on (G,H) indicate position of NC; (I) shows NC (Twist, blue) and placodes (Six1, purple) by double-ISH and embryo is shown in a slightly tilted dorso-lateral view. Twist adjacent to Six1 marks cranial NC. (J) Illustration of known NC-placode cell interactions and the hypothesis that this interaction leads to emergence of the NC stream pattern. Arrowheads on (B-E) indicate NC streams, ‘*’ marks the eye/ optic vesicle; scalebars: 300μm.
Fig 2
Fig 2. Cell-based model of neural crest—placode interactions.
(A-E) Illustration of cellular behaviors in the model: polarized cell motility (A), co-attraction (CoA, B) and contact inhibition of locomotion (CIL, C) between NC-NC cells, and chase and run behavior (D-E) based on Sdf1 chemotaxis (D) and repulsion (E) between NC-placode cells. (F-G) Example simulation of the model, showing initial (E) and final (F) cell configurations with NC (orange) and placodal (red) cells. AP and DV axes indicate axes analogous to anterior-posterior and dorso-ventral directions in embryos. (H) Outline of the simulated NC population at t = 300,600,1200,2100, and 3600 MCS. (I) Inhibitor concentration levels at the end of the simulation mimicking the pattern of inhibitors in vivo. (J) NC cell density probability function related to pair-correlation of cells. Color indicates ρ(r) value, brightness shows number of samples (N) at position r in summation (Eq 1); averaged from n = 20 independent simulation repeats. (K-L) Sections of ρ(r) function shown in (J) along the AP (K) and DV (L) axes. W and L indicate the characteristic width and length. (M) Time evolution of W, L, and the aspect ratio L/W. (N) Average concentration levels in the simulation area. Error bars indicate SEM; n = 20 simulations; a.u.: arbitrary unit; s.u.: simulation unit of one lattice site, the minimal simulated distance; MCS: Monte Carlo time step.
Fig 3
Fig 3. Ectopic neural crest is able to invade normally NC-free territories and form streams.
(A-B) Illustration of autograft experiments showing the control (A) and ectopic-rotated (B) graft arrangements. (C-F) Control experiment after graft healing (C, t = 0) and t = 8h (D), 12h (E), and 16h (F) later. (G) Pseudo-colored overlay of control grafted embryos shown on (C-F). (H-K) Ectopic autograft after healing (H, t = 0) and t = 8h (I), 12h (J), and 16h (K) later. (L) Pseudo-colored overlay of ectopic grafts shown on (H-K). (M) Illustration of stream formation observed in control and ectopic graft experiments. ISH against Twist; arrowheads indicate streams in the grafted locations; ‘*’: eye / optic vesicle; braces indicate initial graft; scalebars: 300μm.
Fig 4
Fig 4. Number of streams is determined by the width of migratory region.
(A-C) Final cell configurations in simulations with varying widths (w) relative to the normal simulation width shown in Fig 3. (D) Number of streams (n) versus relative system width (w) in simulations and in vivo. Error bars: SEM; n = 20 simulations; n = 5 embryos; yellow line indicates linear fit: n(w) = 2.61*w+0.49. (E) Illustration of experiments for perturbing the width of the cranial NC migratory region. (F-H) NC streams revealed by ISH in control (F) and in extended (G, H) cranial NC regions. Lateral view; *, eye; arrowheads, streams; scalebars: 300μm.
Fig 5
Fig 5. Attraction at a distance and repulsion at a shorter range is required for neural crest stream formation.
(A-B) Control (A) and inhibition of Sdf1 chemotaxis (B) in simulations. Representative cell configurations at the end of simulations (t = 3600MCS). (C-D) ISH of post-migratory stage embryo injected with control-Mo (CoMo, C) showing normal NC migration and CxcR4-Mo (D) showing lack of NC migration. (E) Width and length of streams measured from the density probability functions of simulations with different chemotaxis parameters. Arrow indicates default value. (F) Inhibition of CIL in placodal cells in simulations. Configurations of cells at the end of simulation (t = 3600MCS). (G) NC shown by ISH in wild-type embryos with placodes grafted from DshDEP+ injected embryos. (H) Width and length of simulated streams as in (E), corresponding to (F) and (A). Arrow indicates default value. (I) Morphological map of simulated NC streams at various chemotaxis and placodal CIL parameters. Box width and length corresponds to width and length of streams. Box shading from light to dark corresponds decreasing relative standard error of width and length measures. Letters refer to related panels. Error bars on E and H: SEM. N = 20 simulations for each point on E, H, and I. Scalebars: 200μm.
Fig 6
Fig 6. Emergent streams at different neural crest adhesion strengths.
(A, B, E) Final cell configurations in simulations with normal (A), low (B), and high (E) neural crest adhesion parameters (λ_M (NC-NC)). (C, D, F) Streams revealed by ISH in control (C), LPAR2-overexpressing (D), and LPAR2-Mo injected (F) embryos. (G) Stream widths in vivo measured in control embryos and embryos injected with either LPAR2 mRNA (OE, overexpression) or LPAR2-Mo (Mo). Error bars: SEM; n(Ctrl, MO) = 30; n(OE) = 19; ***: p<0.001 Mann-Whitney test. (H) Stream width and length in silico as a function of λ_M (NC-NC). Error bars: SEM. (I, J) Morphological maps of simulated NC streams at various adhesion-placodal CIL, and adhesion-chemotaxis parameters. Box width and length corresponds to width and length of streams. Box shading from light to dark corresponds decreasing relative standard error of width and length measures. Letters refer to related panels. N = 20 simulations for each parameter set. Scalebars: 300μm.
Fig 7
Fig 7. Model for emergent stream formation of the neural crest based on cellular chase and run interaction between the neighboring NC and placode populations.
The gross tissue pattern (left) is determined by dynamic cell-cell interactions (right) without the need for a guiding pre-pattern to determine areas of stream growth. Consolidation of the final stream shapes at later stages are potentially facilitated by other mechanisms to ensure proper integration of the NC with other tissues.

Similar articles

Cited by

References

    1. Keller RE, Shook D, Skoglund P. The forces that shape embryos: physical aspects of convergent extension by cell intercalation. Phys Biol. 2008;5: 015007 10.1088/1478-3975/5/1/015007 - DOI - PubMed
    1. Qiao J, Sakurai H, Nigam SK. Branching morphogenesis independent of mesenchymal-epithelial contact in the developing kidney. Proc Natl Acad Sci. 1999;96: 7330–7335. 10.1073/pnas.96.13.7330 - DOI - PMC - PubMed
    1. Varner VD, Gleghorn JP, Miller E, Radisky DC, Nelson CM. Mechanically patterning the embryonic airway epithelium. Proc Natl Acad Sci. 2015;112: 9230–9235. 10.1073/pnas.1504102112 - DOI - PMC - PubMed
    1. Szabó A, Mayor R. Mechanisms of Neural Crest Migration. Annu Rev Genet. 2018;52: 43–63. 10.1146/annurev-genet-120417-031559 - DOI - PubMed
    1. Gammill LS, Gonzalez C, Bronner-Fraser M. Neuropilin 2/semaphorin 3F signaling is essential for cranial neural crest migration and trigeminal ganglion condensation. Dev Neurobiol. 2007;67: 47–56. 10.1002/dneu.20326 - DOI - PubMed

Publication types