

Spatio-temporal dynamics of dengue in Brazil: Seasonal travelling waves and determinants of regional synchrony
- PMID: 31009460
- PMCID: PMC6497439
- DOI: 10.1371/journal.pntd.0007012
Spatio-temporal dynamics of dengue in Brazil: Seasonal travelling waves and determinants of regional synchrony
Abstract
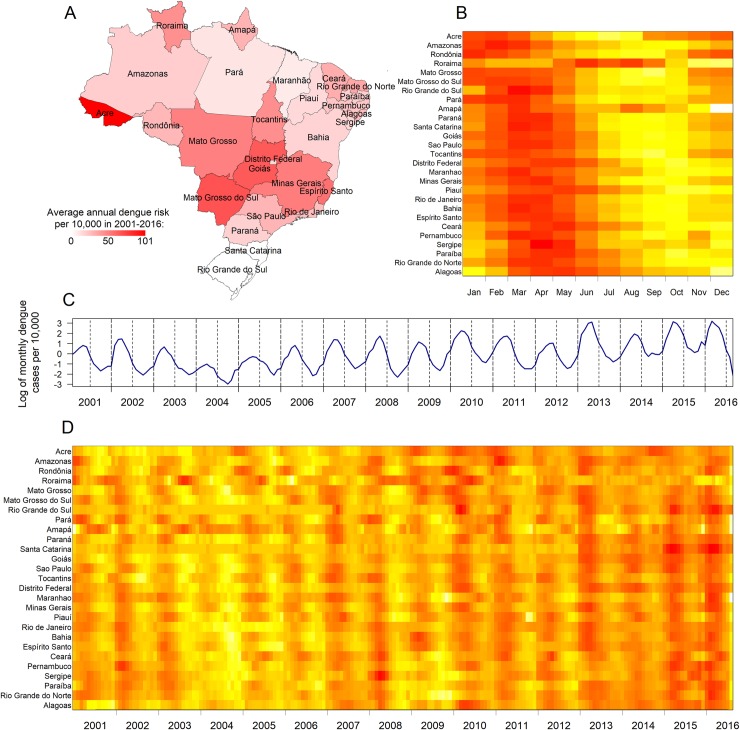
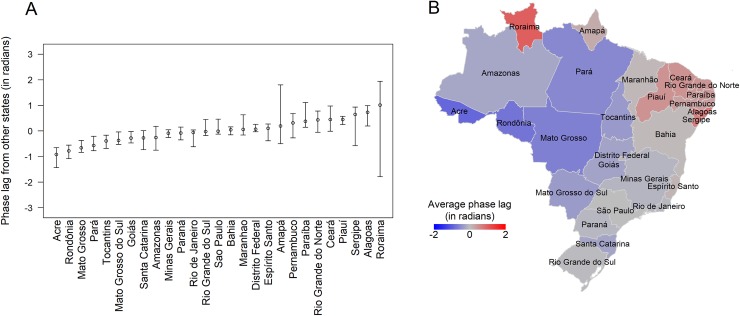
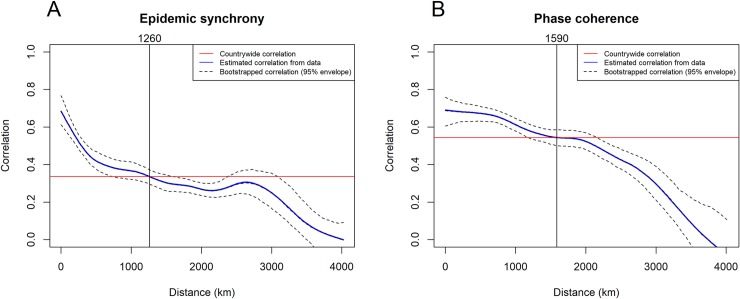
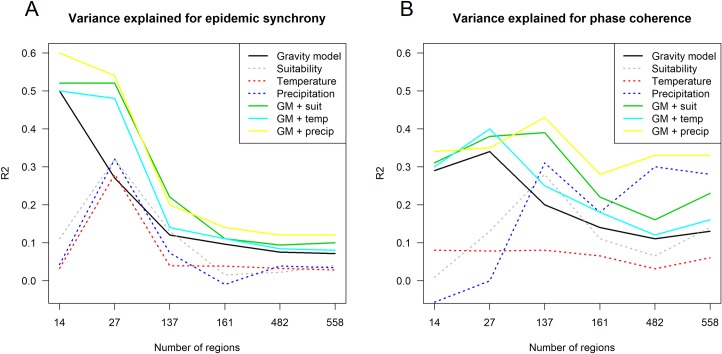
Dengue continues to be the most important vector-borne viral disease globally and in Brazil, where more than 1.4 million cases and over 500 deaths were reported in 2016. Mosquito control programmes and other interventions have not stopped the alarming trend of increasingly large epidemics in the past few years. Here, we analyzed monthly dengue cases reported in Brazil between 2001 and 2016 to better characterise the key drivers of dengue epidemics. Spatio-temporal analysis revealed recurring travelling waves of disease occurrence. Using wavelet methods, we characterised the average seasonal pattern of dengue in Brazil, which starts in the western states of Acre and Rondônia, then travels eastward to the coast before reaching the northeast of the country. Only two states in the north of Brazil (Roraima and Amapá) did not follow the countrywide pattern and had inconsistent timing of dengue epidemics throughout the study period. We also explored epidemic synchrony and timing of annual dengue cycles in Brazilian regions. Using gravity style models combined with climate factors, we showed that both human mobility and vector ecology contribute to spatial patterns of dengue occurrence. This study offers a characterization of the spatial dynamics of dengue in Brazil and its drivers, which could inform intervention strategies against dengue and other arboviruses.
Conflict of interest statement
The authors have declared that no competing interests exist.
Figures
Similar articles
-
Space-time dynamics of the dengue epidemic in Brazil, 2024: an insight for decision making.BMC Infect Dis. 2024 Sep 27;24(1):1056. doi: 10.1186/s12879-024-09813-z. BMC Infect Dis. 2024. PMID: 39333905 Free PMC article.
-
Epidemiology of dengue and the effect of seasonal climate variation on its dynamics: a spatio-temporal descriptive analysis in the Chao-Shan area on China's southeastern coast.BMJ Open. 2019 May 24;9(5):e024197. doi: 10.1136/bmjopen-2018-024197. BMJ Open. 2019. PMID: 31129573 Free PMC article.
-
Spatial and temporal distribution of dengue in Brazil, 1990 - 2017.PLoS One. 2020 Feb 13;15(2):e0228346. doi: 10.1371/journal.pone.0228346. eCollection 2020. PLoS One. 2020. PMID: 32053623 Free PMC article.
-
[Dengue and its vectors in Brazil].Bull Soc Pathol Exot. 1996;89(2):128-35; discussion 136. Bull Soc Pathol Exot. 1996. PMID: 8924771 Review. French.
-
Dengue and dengue hemorrhagic fever epidemics in Brazil: what research is needed based on trends, surveillance, and control experiences?Cad Saude Publica. 2005 Sep-Oct;21(5):1307-15. doi: 10.1590/s0102-311x2005000500002. Epub 2005 Sep 12. Cad Saude Publica. 2005. PMID: 16158135 Review.
Cited by
-
Host movement, transmission hot spots, and vector-borne disease dynamics on spatial networks.Infect Dis Model. 2022 Nov 4;7(4):742-760. doi: 10.1016/j.idm.2022.10.006. eCollection 2022 Dec. Infect Dis Model. 2022. PMID: 36439402 Free PMC article.
-
A cross-sectional survey to evaluate prescribers' knowledge and understanding of safety messages following Dengvaxia® product information update.Pharmacoepidemiol Drug Saf. 2022 Jul;31(7):758-768. doi: 10.1002/pds.5447. Epub 2022 May 13. Pharmacoepidemiol Drug Saf. 2022. PMID: 35505623 Free PMC article.
-
Spatial and temporal trends of dengue infections in Curaçao: A 21-year analysis.Parasite Epidemiol Control. 2024 Jan 26;24:e00338. doi: 10.1016/j.parepi.2024.e00338. eCollection 2024 Feb. Parasite Epidemiol Control. 2024. PMID: 38323192 Free PMC article.
-
Data-rich modeling helps answer increasingly complex questions on variant and disease interactions: Comment on "Mathematical models for dengue fever epidemiology: A 10-year systematic review" by Aguiar et al.Phys Life Rev. 2023 Mar;44:197-200. doi: 10.1016/j.plrev.2023.01.009. Epub 2023 Feb 2. Phys Life Rev. 2023. PMID: 36773393 Free PMC article. No abstract available.
-
Rising Incidence and Spatiotemporal Dynamics of Emerging and Reemerging Arboviruses in Brazil.Viruses. 2025 Jan 24;17(2):158. doi: 10.3390/v17020158. Viruses. 2025. PMID: 40006913 Free PMC article.
References
Publication types
MeSH terms
Grants and funding
LinkOut - more resources
Full Text Sources
Medical
Miscellaneous
