. 2019 Apr 22;14(4):e0215547.
doi: 10.1371/journal.pone.0215547. eCollection 2019.

Strategies in regulating glioblastoma signaling pathways and anti-invasion therapy

Affiliations

Strategies in regulating glioblastoma signaling pathways and anti-invasion therapy

Eunok Jung et al. PLoS One. .

Abstract

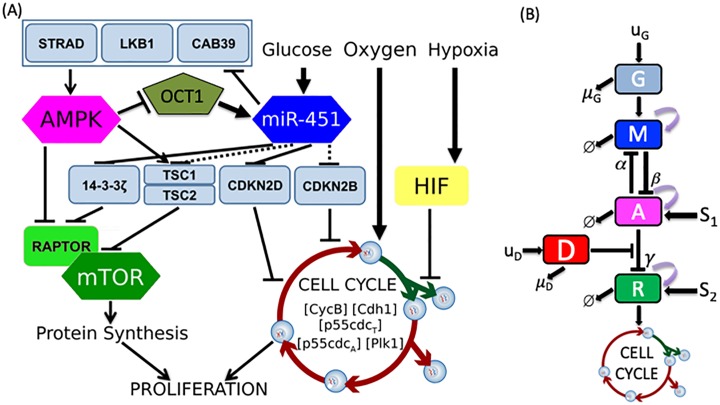
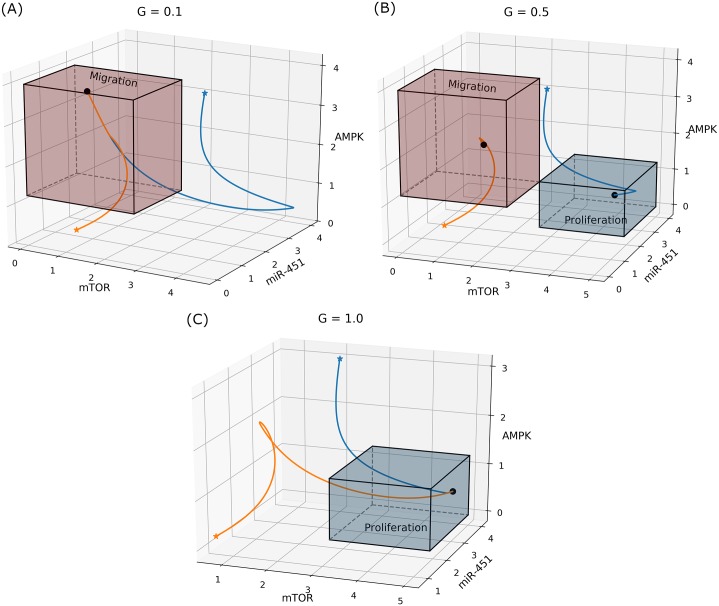
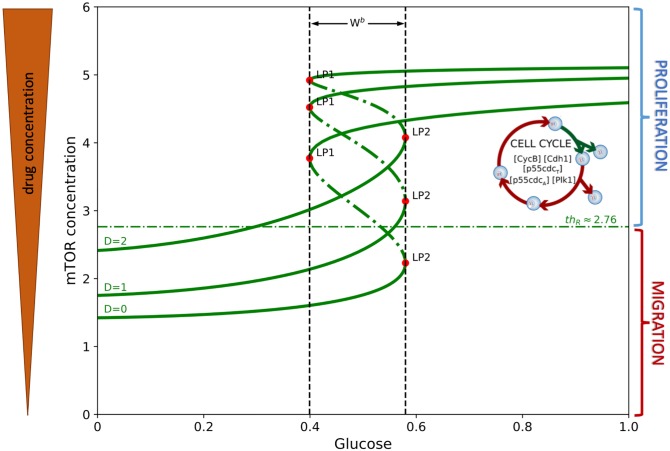
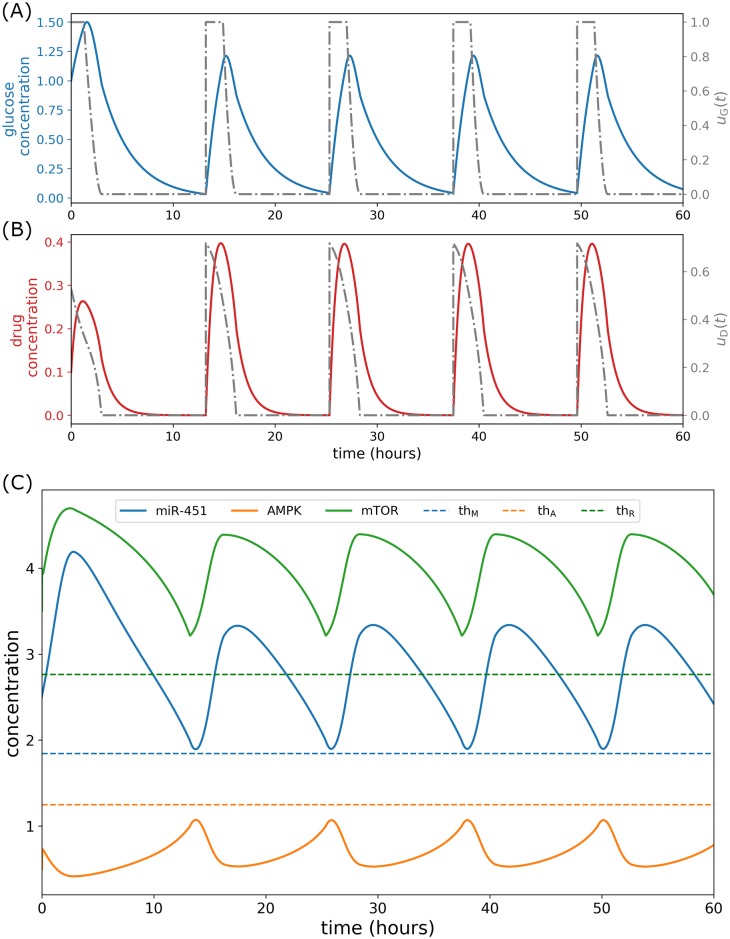
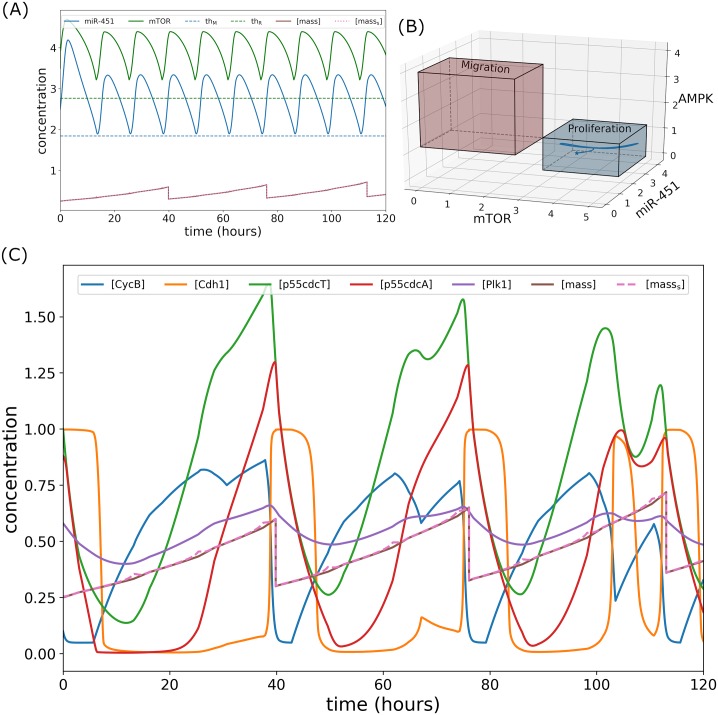
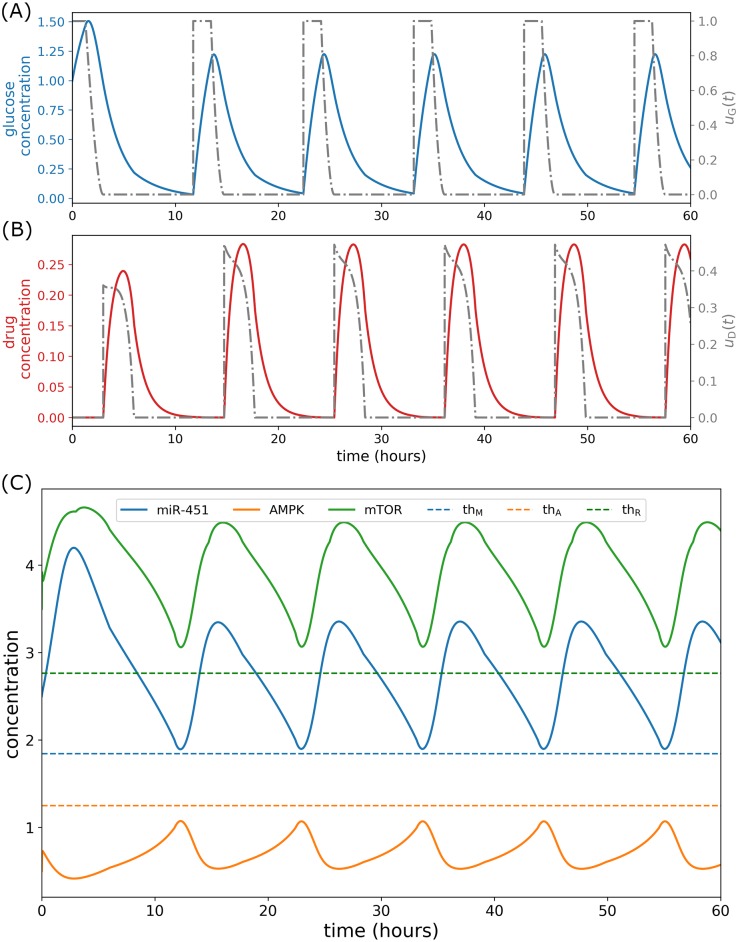
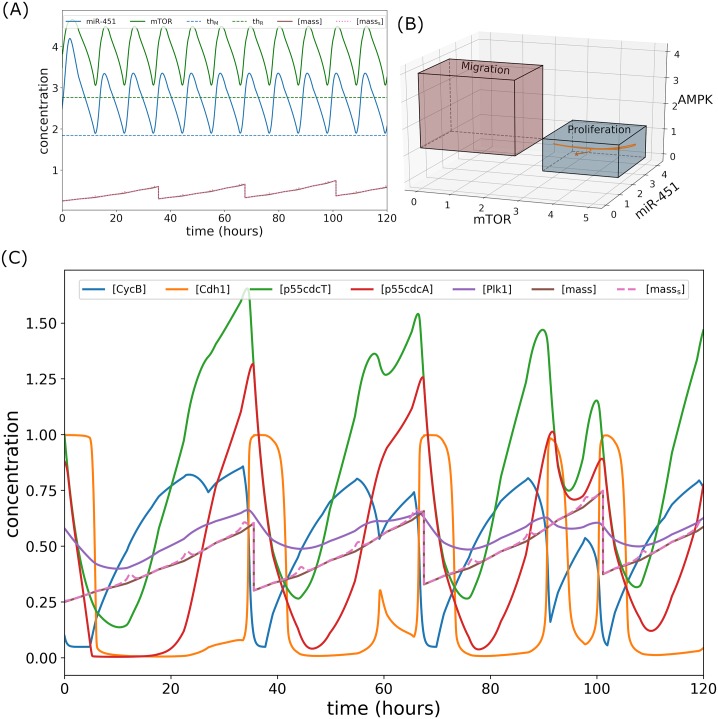
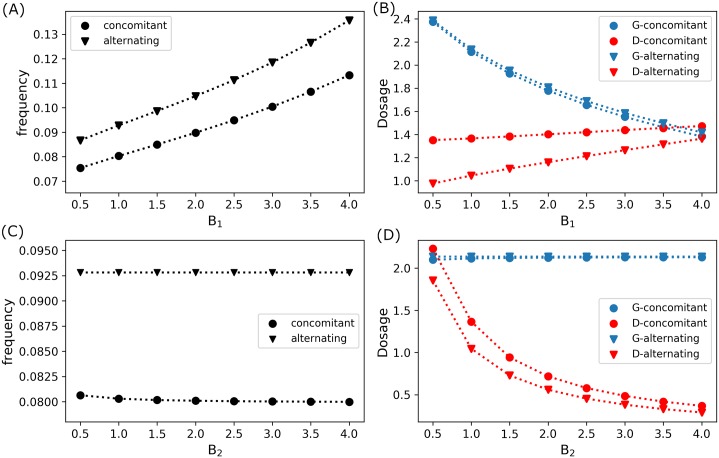
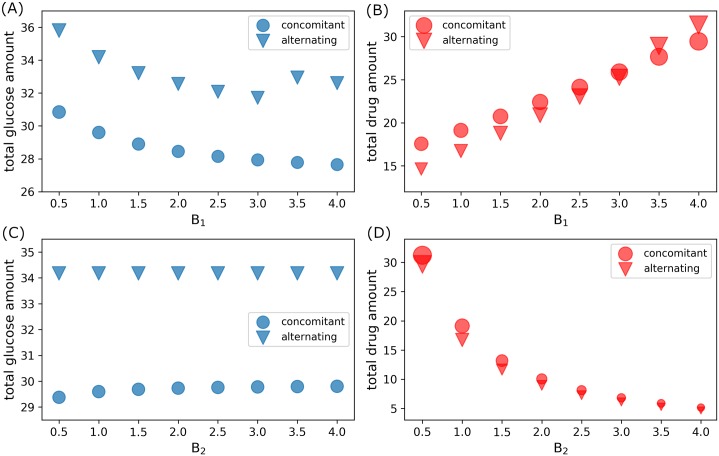
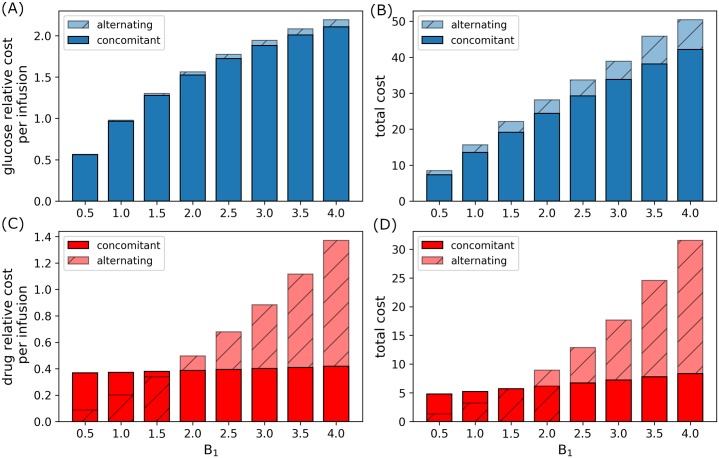
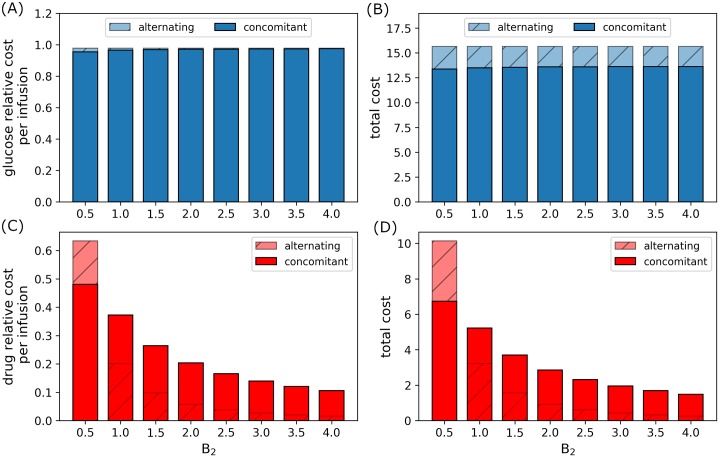
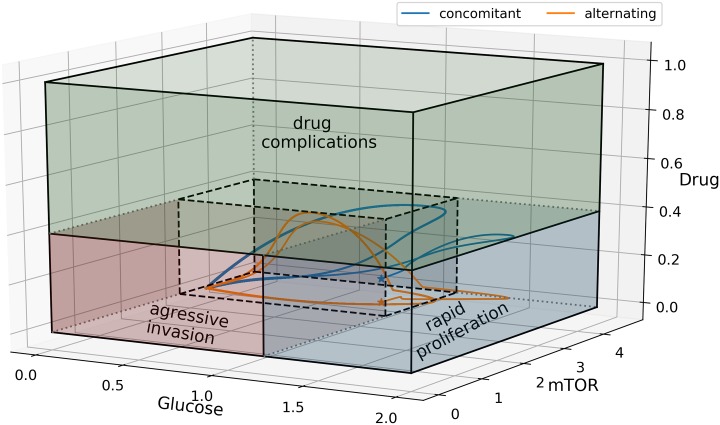
Glioblastoma multiforme is one of the most invasive type of glial tumors, which rapidly grows and commonly spreads into nearby brain tissue. It is a devastating brain cancer that often results in death within approximately 12 to 15 months after diagnosis. In this work, optimal control theory was applied to regulate intracellular signaling pathways of miR-451-AMPK-mTOR-cell cycle dynamics via glucose and drug intravenous administration infusions. Glucose level is controlled to activate miR-451 in the up-stream pathway of the model. A potential drug blocking the inhibitory pathway of mTOR by AMPK complex is incorporated to explore regulation of the down-stream pathway to the cell cycle. Both miR-451 and mTOR levels are up-regulated inducing cell proliferation and reducing invasion in the neighboring tissues. Concomitant and alternating glucose and drug infusions are explored under various circumstances to predict best clinical outcomes with least administration costs.


Conflict of interest statement

The authors have declared that no competing interests exist.

Figures

Fig 1
Fig 1. A model of the miR-451–AMPK–mTOR–cell cycle signaling pathway.
(A) Detailed schematic diagram of cellular decision of proliferation and migration in glioblastoma [40]. (B) Block diagram of the theoretical model representing glucose (G) regulation on miR-451 (M), AMPK (A), mTOR (R) with the signaling pathway to the cell cycle dynamics and the drug (D) suppressing the inhibition of mTOR by AMPK.
Fig 2
Fig 2. Effect of glucose on regulation of the core control system.
Two trajectories of core control control concentrations in miR-451–AMPK–mTOR space in response to (A) low (G = 0.1), (B) intermediate (G = 0.5), and (C) high (G = 1.0) glucose levels.
Fig 3
Fig 3. Bifurcation diagram of mTOR.
Hysteresis diagram of mTOR concentration over the range of glucose levels and the corresponding effect of different drug concentrations on its dynamics.
Fig 4
Fig 4. Sensitivity analysis on bistability of core control system.
PRCC values of the core control model parameters influencing the bistability of the (G, R) hysteresis curve. The double asterisk (**) indicates a p-value of less than 0.01. The sample size carried out in the method is N = 100, 000.
Fig 5
Fig 5. Effect of parameters 1, 4, 5, 6 on the core control nullclines and bistability.
M- and A-nullclines for different 1 and 4 values for specific glucose levels: (A) G = 0.1, (B) G = 0.4, and (C) G = 0.8, showing instances of bistability and monostability. (D) Bifurcation curves for 1 and 4 and shaded region of bistability. (E) R- and A-nullclines for different 5 and 6 values showing monostability.
Fig 6
Fig 6. Codimension 2 bifurcation.
(A) Hysteresis diagram of mTOR concentration over glucose level for three different values of S1 = 0, 0.2, 0.34. (B) Codimension 2 bifurcation varying G and S1 showing the equilibrium curves and cusp point (CP). Bistable and monostable regions are also depicted.
Fig 7
Fig 7. Typical cell cycle dynamics.
Dynamics of intracellular proteins, mass, and masss of the cell cycle model in response to constant (intermediate) high glucose level.
Fig 8
Fig 8. Intracellular dynamics under regular glucose and drug infusions.
(A) Concentration profiles of miR-451 (M) and mTOR (R) fluctuating around the threshold values under regular infusions. Peaks in pseudo-mass are generated when M and R crosses thM and thR, respectively. (B) Trajectory of mTOR–miR-451–AMPK concentration profiles switching between proliferation and migration mode. (C) Dynamics of intracellular proteins, mass, and masss of the cell cycle model in response to regular glucose and drug infusions.
Fig 9
Fig 9. Concomitant glucose and drug control.
(A) Glucose control and concentration levels, (B) drug control and concentration levels, and (C) concentration profiles of miR-451, AMPK complex, and mTOR under concomitant control.
Fig 10
Fig 10. Intracellular dynamics under concomitant glucose and drug control.
(A) Concentration profiles of miR-451 (M) and mTOR (R) above the threshold values under concomitant infusions. (B) Trajectory of mTOR–miR-451–AMPK concentration profiles restrained in the proliferation region. (C) Dynamics of intracellular proteins, mass, and masss of the cell cycle model in response to concomitant glucose and drug infusions.
Fig 11
Fig 11. Alternating glucose and drug control.
(A) Glucose control and concentration levels, (B) drug control and concentration levels, and (C) concentration profiles of miR-451, AMPK complex, and mTOR under alternating control.
Fig 12
Fig 12. Intracellular dynamics under alternating glucose and drug control.
(A) Concentration profiles of miR-451 (M) and mTOR (R) above the threshold values under concomitant infusions. (B) Trajectory of mTOR–miR-451–AMPK concentration profiles restrained in the proliferation region. (C) Dynamics of intracellular proteins, mass, and masss of the cell cycle model in response to alternating glucose and drug infusions.
Fig 13
Fig 13. Frequency and dosage of optimal infusions.
(A) Frequency and (B) dose per optimal infusion of concomitant (circle) and alternating (triangle) controls with fixed drug administration cost B2 = 1.0 and varying glucose administration cost B1. (C) Frequency and (D) dose per optimal infusion of concomitant (circle) and alternating (triangle) controls with fixed glucose administration cost B1 = 1.0 and varying drug administration cost B2.
Fig 14
Fig 14. Total glucose and drug amount used in concomitant and alternating control infusions.
(A) Total glucose and (B) drug amount used in concomitant (circle) and alternating (triangle) controls with fixed drug administration cost B2 = 1.0 and varying glucose administration cost B1. (C) Total glucose and (D) drug amount used in concomitant (circle) and alternating (triangle) controls with fixed glucose administration cost B1 = 1.0 and varying drug administration cost B2.
Fig 15
Fig 15. Relative administration cost for varying B1.
Relative glucose administration (A) cost per infusion and (B) total cost, and relative drug administration (C) cost per infusion and (D) total cost incurred for a period of 168h (7d) for concomitant and alternating controls with increasing B1.
Fig 16
Fig 16. Relative administration cost for varying B2.
Relative glucose administration (A) cost per infusion and (B) total cost, and relative drug administration (C) cost per infusion and (D) total cost incurred for a period of 168h (7d) for concomitant and alternating controls with increasing B2.
Fig 17
Fig 17. Glucose–mTOR–drug dynamics for concomitant and alternating controls.
Concomitant (blue) and alternating (orange) control trajectories are confined in a smaller region avoiding aggressive invasion, rapid proliferation, and unwanted drug complications.

Similar articles

Cited by

References

    1. Chintala SK, Tonn JC, Rao JS. Matrix metalloproteinases and their biological function in human gliomas. Int J Dev Neurosci. 1999;17(5-6):495–502. 10.1016/S0736-5748(99)00010-6 - DOI - PubMed
    1. Furnari FB, Fenton T, Bachoo RM, Mukasa A, Stommel JM, Stegh A, et al. Malignant astrocytic glioma: genetics, biology, and paths to treatment. Genes Dev. 2007;21(21):2683–710. 10.1101/gad.1596707 - DOI - PubMed
    1. Davis FG, McCarthy BJ. Current epidemiological trends and surveillance issues in brain tumors. Expert Rev Anticancer Ther. 2001;1(3):395–401. 10.1586/14737140.1.3.395 - DOI - PubMed
    1. Warburg O. On the origin of cancer cells. Science. 1956;123(3191):309–14. 10.1126/science.123.3191.309 - DOI - PubMed
    1. Heiden MGV, Cantley LC, Thompson CB. Understanding the Warburg effect: the metabolic requirements of cell proliferation. Science. 2009;324(5930):1029–33. 10.1126/science.1160809 - DOI - PMC - PubMed

Publication types

MeSH terms