

Review
doi: 10.1167/iovs.19-26672.
Leber Congenital Amaurosis (LCA): Potential for Improvement of Vision
Affiliations
- PMID: 31009524
- PMCID: PMC6892385
- DOI: 10.1167/iovs.19-26672
Item in Clipboard
Review
Leber Congenital Amaurosis (LCA): Potential for Improvement of Vision
Invest Ophthalmol Vis Sci.
.
No abstract available
Figures
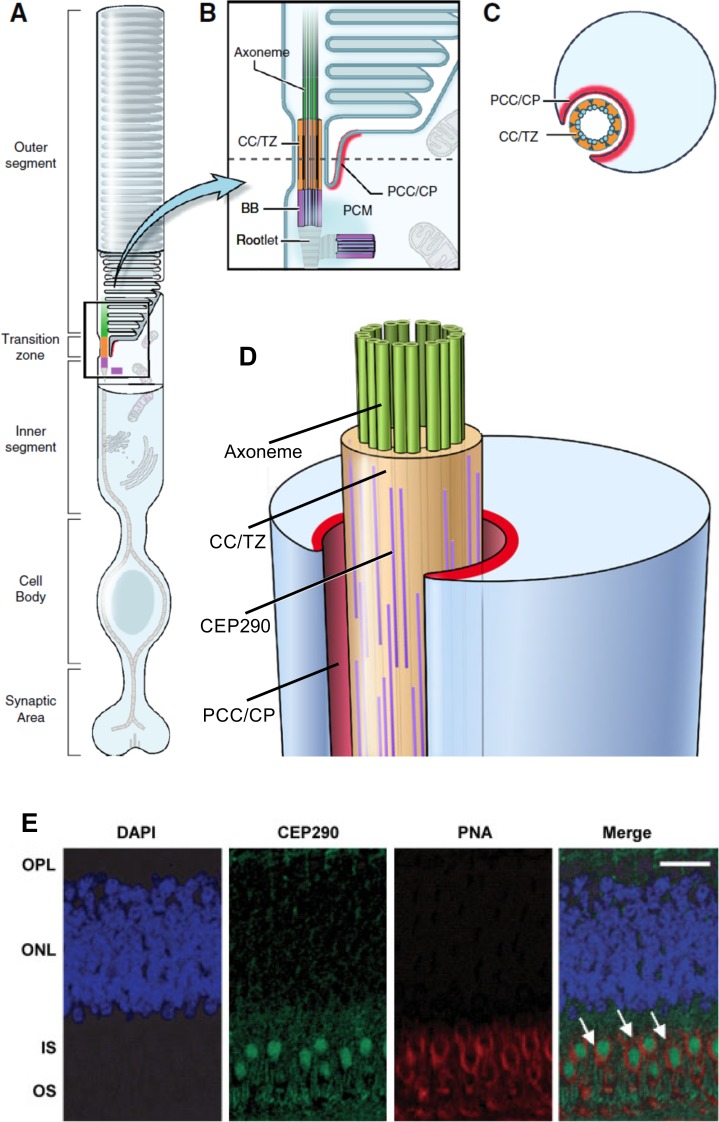
CEP290 expression in rod and cone photoreceptors. (A) Schematic of a rod photoreceptor, showing specialized domains of the cell. (B) Enlargement of the rod photoreceptor transition zone showing the structural and functional domains in which most ciliary proteins are expressed: axoneme (green), connecting cilium/transition zone (CC/TZ; orange), basal body (BB; purple), periciliary complex or ciliary pocket (PCC/CP; red). (C) Cross section through the CC/TZ showing the relationship between the microtubules of the cilium and the inner segment, via the PCC/CP. (A–C) Reprinted and modified with permission from Rachel RA, Li T, Swaroop A. Photoreceptor sensory cilia and ciliopathies: focus on CEP290, RPGR and their interacting proteins. Cilia. 2012;1:22. © 2012 The Authors. Published by BioMed Central, Ltd. (D) Three-dimensional representation of the transition zone and adjacent domains. Possible positions of rod-like coiled-coil domain proteins such as CEP290, which localize to the region of the Y-linkers between the plasma membrane and the microtubule ring. Reprinted and modified with permission of Rachel RA, Yamamoto EA, Dewanjee MK, et al. CEP290 alleles in mice disrupt tissue-specific cilia biogenesis and recapitulate features of syndromic ciliopathies. Hum Mol Genet. 2015;24:3775–3791. © 2015 The Authors. Published by Oxford University Press. (E) Immunofluorescence staining of CEP290 in macular cones of monkey retina. Sections stained with CEP290 (green) and cone-specific marker PNA (red) indicate colocalization (Merge; arrows). DAPI (blue) used to stain the nuclei. Scale bar: 10 μm. Reprinted with permission from Cideciyan AV, Aleman TS, Jacobson SG, et al. Centrosomal-ciliary gene CEP290/NPHP6 mutations result in blindness with unexpected sparing of photoreceptors and visual brain: implications for therapy of Leber congenital amaurosis. Hum Mutat. 2007;28:1074–1083. © 2007 John Wiley & Sons, Inc. Published by Wiley-Liss, Inc.
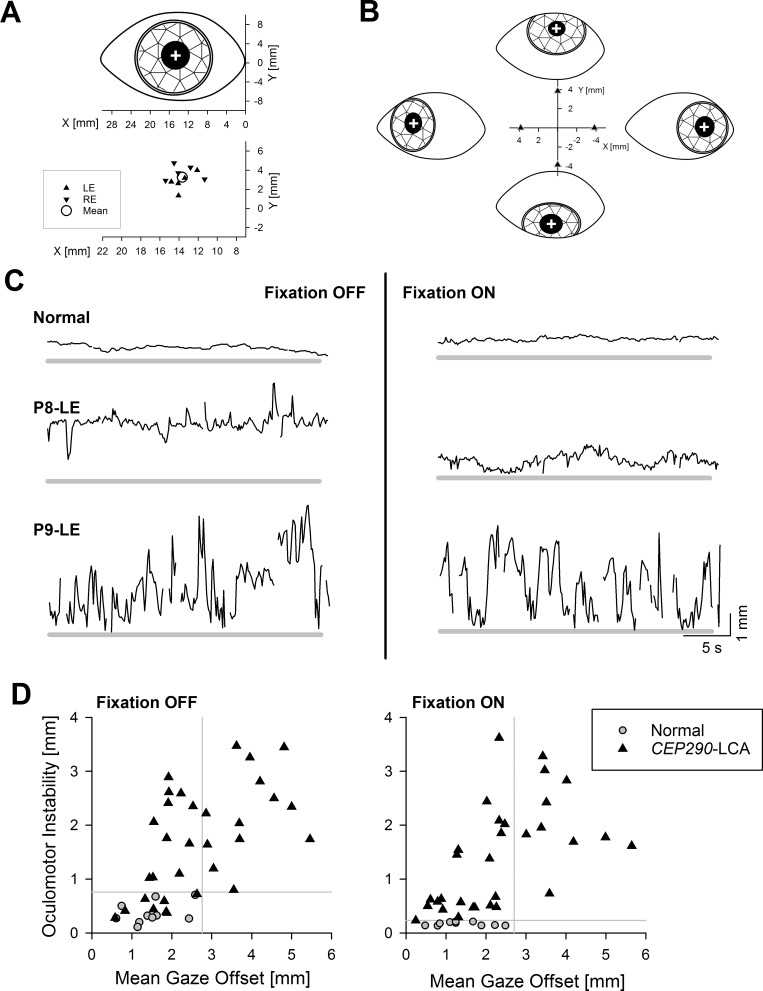
Spectrum of oculomotor features in CEP290-LCA. (A) Upper: Schematic representation of the coordinate system centered at the medial (nasal) canthus and the center of pupil (white cross) at primary gaze. Lower: Individual data from left (LE) and right (RE) eyes of all normal subjects at primary gaze. Mean value is also shown (circle). (B) Schematic representation of eyes fixating 30° eccentric along the four cardinal directions, and relative offsets of the center of pupil measured from the primary gaze locus. (C) Chart records showing the radial offset of the center of pupil from the mean normal primary gaze locus (thick gray line) during a 30-second-long recording epoch in a representative normal subject and two CEP290-LCA eyes. Two records shown are with (right column) and without (left column) fixation. (D) Oculomotor instability plotted against mean gaze offset in individual CEP290-LCA eyes (triangles; n = 32 eyes of 16 patients) recorded with and without fixation. Equivalent results from normal eyes are also shown (gray circles). Gray lines demarcate the upper (mean + 2 SD) limits of normal for each parameter. Reprinted with permission from Jacobson SG, Cideciyan AV, Sumaroka A, et al. Outcome measures for clinical trials of Leber congenital amaurosis caused by the intronic mutation in the CEP290 gene. Invest Ophthalmol Vis Sci. 2017;58:2609–2622. © 2017 The Authors. Published by ARVO.
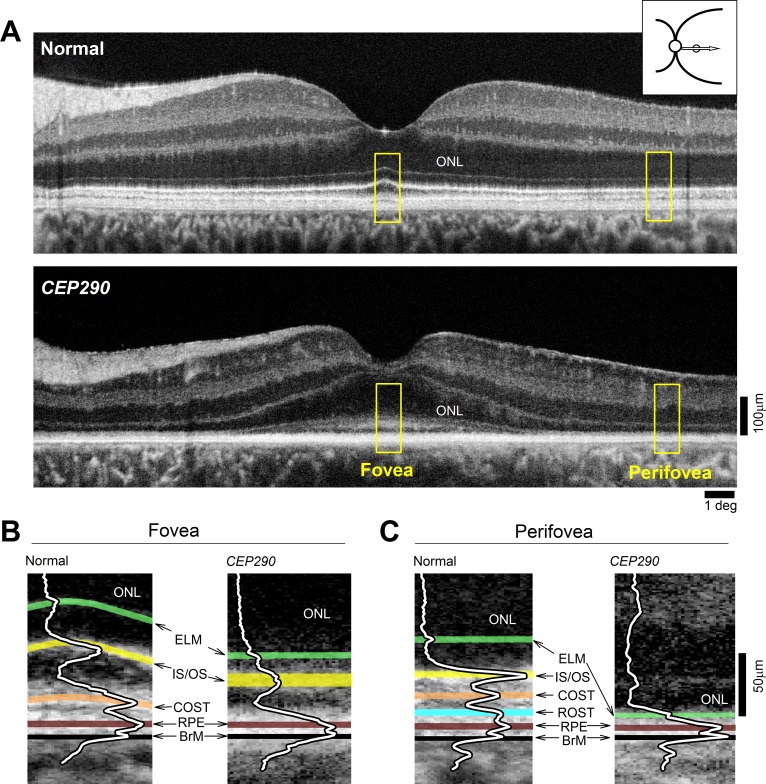
Retained photoreceptor nuclei with abnormal segments in CEP290-LCA. (A) OCT scans along the horizontal meridian through the fovea in a normal subject, and a CEP290-LCA patient. Images were obtained with a clinical ultrahigh resolution SDOCT system (Bi-μ; Kowa Company, Ltd.). Hyposcattering layer corresponding to the ONL is shown. Inset upper right shows location of scan. Yellow boxes outline foveal and perifoveal regions shown in (B, C). (B, C) Magnified views of the outer retina at foveal and temporal perifoveal locations demonstrating differences in the layers distal to the ONL. Overlaid are the longitudinal reflectivity profiles (LRPs). Hyperscattering signals highlighted as follows: green, ELM; yellow, IS/OS, near the junction of inner and outer segments; orange, COST, near the interface of cone outer segment tips and RPE contact cylinder (also called the interdigitation zone); cyan, ROST, near the interface between rod outer segment tips and RPE apical processes; brown, RPE, near the RPE cell bodies; and black, BrM, Bruch membrane. Figure courtesy of Alexander Sumaroka (Scheie Eye Institute, University of Pennsylvania).
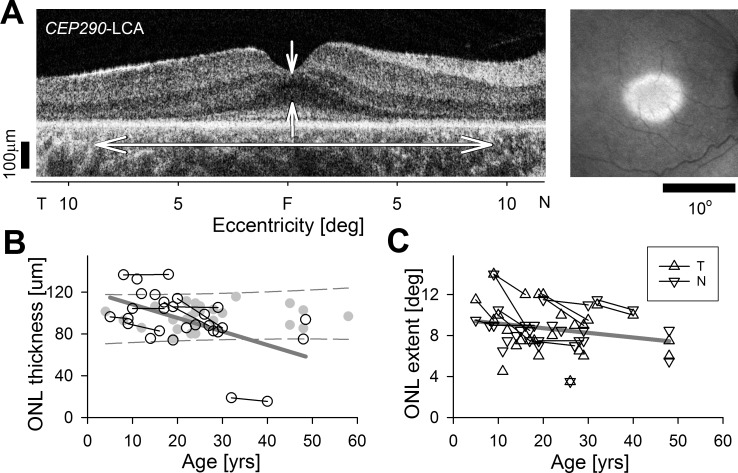
Slow rate of cone photoreceptor degeneration in CEP290-LCA. (A) Horizontal OCT from a CEP290-LCA patient (left) demonstrating the foveal ONL thickness and ONL extent measures. Near-infrared autofluorescence imaging (right) demonstrating preserved central macular region of RPE melanization. (B, C) Quantitation of foveal ONL thickness (B), and ONL extent from fovea in nasal and temporal directions (C) in a group of CEP290-LCA patients evaluated cross-sectionally at different ages. Also shown are a subset of patients with longitudinal data (connected symbols). Linear regressions (thick gray line) fit to all data. Redrawn from data in Jacobson SG, Cideciyan AV, Sumaroka A, et al. Outcome measures for clinical trials of Leber congenital amaurosis caused by the intronic mutation in the CEP290 gene. Invest Ophthalmol Vis Sci. 2017;58:2609–2622. © 2017 The Authors. Published by ARVO.
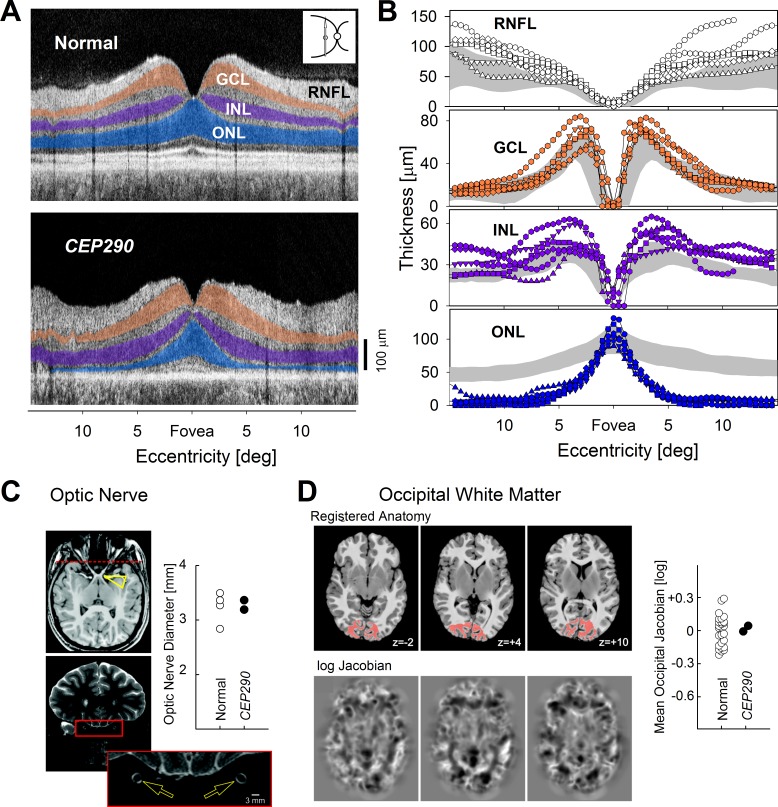
Postreceptoral structures along the retinocortical pathway in CEP290-LCA. (A) Left, OCT scans along the vertical meridian in a normal subject and a CEP290-LCA patient. ONL is highlighted blue, INL is highlighted purple, and GCL is highlighted orange. (B) Quantitation of the three nuclear layer and the RNFL thickness in 6 CEP290-LCA patients compared with normal results (shaded areas; mean ± 2 SD). (C) Optic nerve anatomy. A normal-appearing optic chiasm (arrowhead) observed on T1 imaging. High-resolution T2-weighted axial and coronal images were obtained through the optic nerves. The position of the coronal slice displayed is indicated by the dashed line on the axial image. The cross-sectional diameter of the interpial optic nerve (arrows) was estimated at three positions along each nerve, and the average diameter is within the range of normal (plot). (D) Whole-brain morphometric analysis. The T1-weighted anatomic images from CEP290-LCA and controls were warped to a representative template (top row). The (log) determinant of the Jacobian matrix calculated during warping for each subject (bottom row) indexes the degree to which cerebral tissue is smaller or larger than the template image. No significant deviation from control measures was seen in two CEP290-LCA patients. A focused analysis was conducted within occipital lobe white matter (red on the registered anatomy). The z-position (mm) of each axial slice relative to the anterior commissure is indicated. The average (log) Jacobian measure within the occipital white matter for CEP290-LCA and normal subjects indicates no differences (plot). (C, D) Reprinted with permission from Cideciyan AV, Aleman TS, Jacobson SG, et al. Centrosomal-ciliary gene CEP290/NPHP6 mutations result in blindness with unexpected sparing of photoreceptors and visual brain: implications for therapy of Leber congenital amaurosis. Hum Mutat. 2007;28:1074–1083. © 2007 John Wiley & Sons, Inc. Published by Wiley-Liss, Inc.
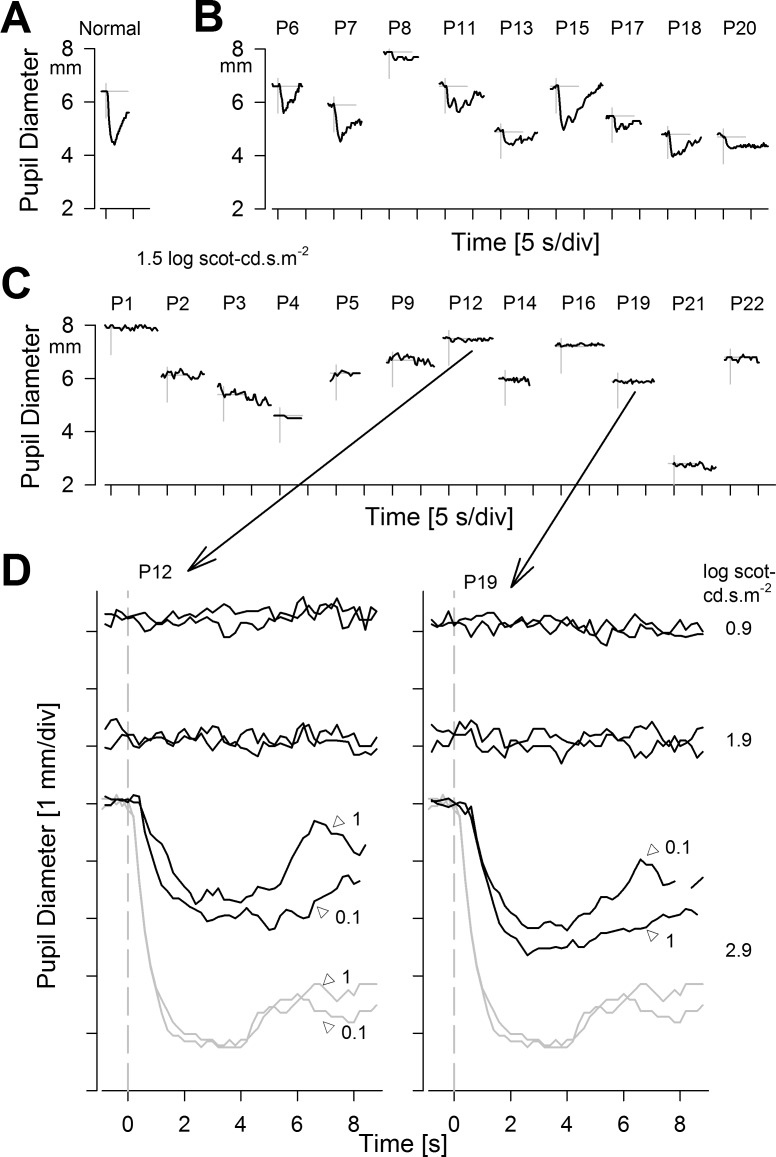
Pupillary light reflexes in CEP290-LCA. (A–C) Dynamics of pupil constriction in the dark to a 0.1-second-duration achromatic bright standard stimulus (1.5 log scot-cd.s.m−2) in a representative normal (A), CEP290-LCA patients grouped into those with detectable responses (B), and those without (C). (A–C) Modified from Jacobson SG, Cideciyan AV, Sumaroka A, et al. Outcome measures for clinical trials of Leber congenital amaurosis caused by the intronic mutation in the CEP290 gene. Invest Ophthalmol Vis Sci. 2017;58:2609–2622. © 2017 The Authors. Published by ARVO. (D) Use of higher stimulus luminance range in two of the eyes with no pupillary response to standard stimuli. Notably, 0.9 and 1.9 log scot-cd.s.m−2 stimuli do not evoke responses, whereas 2.9 log scot-cd.s.m−2 stimuli evoke definite responses that are smaller and slower than normal. Similarity of responses with 0.1- and 1-second-long stimuli suggests reciprocity between stimulus luminance and duration. (D) Modified from Charng J, Jacobson SG, Heon E, et al. Pupillary light reflexes in severe photoreceptor blindness isolate the melanopic component of intrinsically photosensitive retinal ganglion cells. Invest Ophthalmol Vis Sci. 2017;58:3215–3224. © 2017 The Authors. Published by ARVO.
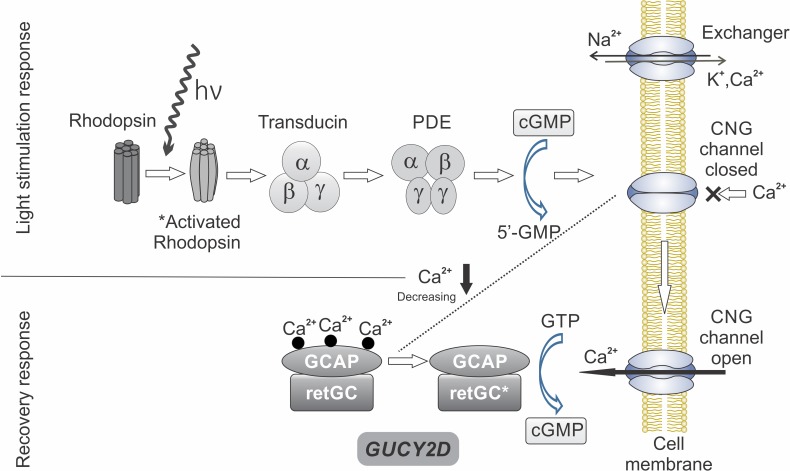
Phototransduction and GUCY2D. Absorption of light by rhodopsin in the rod photoreceptor outer segment activates rhodopsin and starts the cascade of reactions that successively include activation of transducin and cGMP phosphodiesterase (PDE), which hydrolyzes cGMP. Reduction in the concentration of cGMP leads to closure of cGMP-gated channels (CNG). The recovery response occurs as there is continued decrease of intracellular Ca2+ and activation of guanylyl cyclase (retGC) by GCAP (guanylyl cyclase activating protein). This replenishes cGMP and causes reopening of CNG. GUCY2D, the gene encoding retGC, is key to response recovery. Redrawn and reprinted with permission from Boye SE. Insights gained from gene therapy in animal models of retGC1 deficiency. Front Mol Neurosci. 2014:7:43. © 2014 Boye.
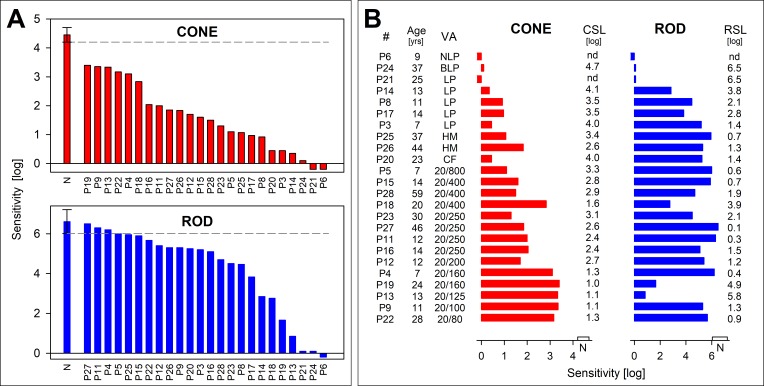
Rod and cone photoreceptor-mediated function in GUCY2D-LCA. Full-field sensitivities for light-adapted red (red bars) and dark-adapted blue flashes (blue bars) to assess cone and rod function, respectively. (A) Sensitivities are ranked from high to low to illustrate the range of dysfunction in GUCY2D-LCA patients. All cone sensitivities are abnormal by 1 log unit or more, and the range includes very severe dysfunction. Rod sensitivities could reach normal levels in some patients, and there can be relatively good rod function in the majority of patients. Note that patient order (horizontal axis in each graph) is not the same for both rod and cone sensitivity levels, indicating that patients with better cone function are not necessarily the same as those with better rod function. (B) Cone and rod function ranked by visual acuity (lowest to highest, top to bottom). There is a strong relationship between acuity and the cone metrics, but rod and cone sensitivity are not closely related, as mentioned in (A). NLP, no light perception; BLP, bare light perception; LP, light perception; HM, hand motions; CF, count fingers; nd, not detected. Negative-going bars indicate no perception of the stimuli. Rod sensitivity for patient 21 and patient 24 and cone sensitivity for patient 24 were very close to instrument limit; these bars were set to 0.1 for this depiction. Brackets on (A) and bars on the horizontal axes on (B) are centered on the normal (N) mean sensitivity and the limits represent ±2 SD. Figure courtesy of Alejandro J. Roman (Scheie Eye Institute, University of Pennsylvania).
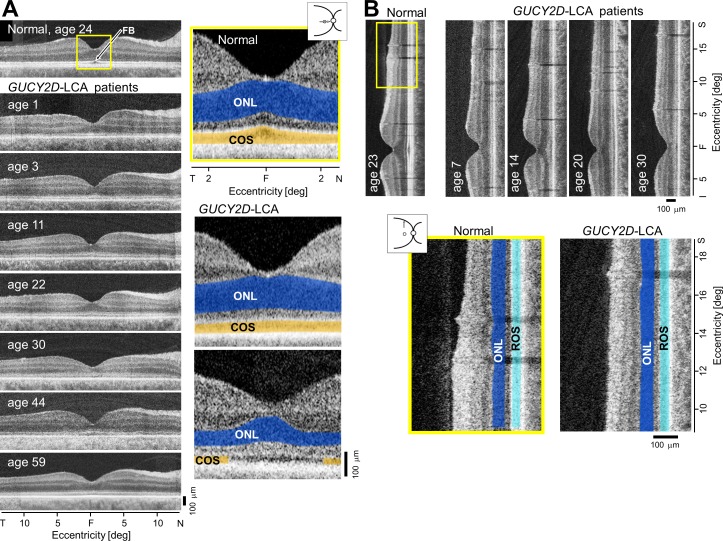
Retinal structure at the fovea and perifovea in GUCY2D-LCA. (A) Cross-sectional OCT scans along the horizontal meridian through the fovea (F) in a normal subject and seven GUCY2D-LCA patients, ranging in age from 1 to 59 years. Enlarged central scans (yellow box) in a normal subject and two GUCY2D-LCA patients are also shown. The ONL is highlighted in blue and the COS layer is in orange. The upper image from a patient illustrates a thinned COS layer but normal ONL. The lower image is from a patient with reduced ONL thickness and an interrupted COS layer, suggesting a central absence of COS. FB, foveal bulge. (B) OCT scans along the vertical meridian including the fovea and continuing into the superior perifoveal region in a normal subject and four patients with GUCY2D-LCA ranging in age from 7 to 30 years. Enlarged scans (yellow box) in a normal subject and a patient showing comparable ONL (blue) and rod outer segment layer (light blue) thickness. Figure courtesy of Alexander Sumaroka (Scheie Eye Institute, University of Pennsylvania).
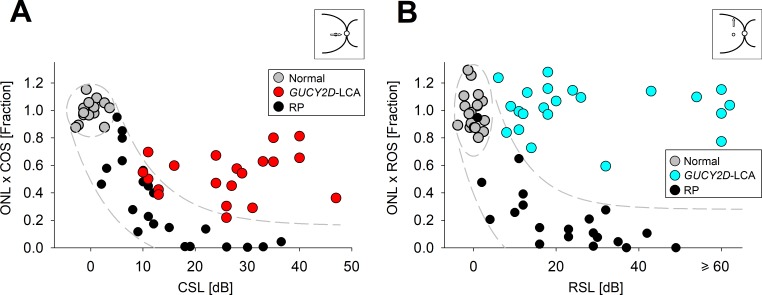
Relation of retinal structure and visual function in GUCY2D-LCA. (A) Relationship between product of foveal ONL and COS thickness (as a fraction of normal mean) and visual function (cone sensitivity loss, CSL) in GUCY2D-LCA patients (red), normal control subjects (gray), and patients with forms of autosomal recessive retinitis pigmentosa, RP (black). CSL is estimated from FST in GUCY2D-LCA and foveal cone perimetry in other patients and normal subjects. (B) Relationship between product of rod hotspot ONL and ROS thickness (as a fraction of normal mean) and visual function (rod sensitivity loss, RSL) in GUCY2D-LCA patients (blue), normal control subjects (gray), and patients with various forms of RP (black). RSL is estimated from FST in GUCY2D-LCA and from dark-adapted perimetry in other patients and normal subjects. The ellipses in (A, B) enclose the 95% confidence interval of bivariate Gaussian distributions, indicating the regions of normal variability. Translating the normal variability along an idealized model for pure photoreceptor degenerations produced a region of uncertainty, which is shown as the areas bound by the dashed lines. Figure courtesy of Alexander Sumaroka and Alejandro J. Roman (Scheie Eye Institute, University of Pennsylvania).
Similar articles
-
The genetic profile of Leber congenital amaurosis in an Australian cohort.Mol Genet Genomic Med. 2017 Nov;5(6):652-667. doi: 10.1002/mgg3.321. Epub 2017 Aug 22. Mol Genet Genomic Med. 2017. PMID: 29178642 Free PMC article.
-
Visual acuity in patients with Leber's congenital amaurosis and early childhood-onset retinitis pigmentosa.Ophthalmology. 2010 Jun;117(6):1190-8. doi: 10.1016/j.ophtha.2009.09.056. Epub 2010 Jan 15. Ophthalmology. 2010. PMID: 20079931
-
Copy number variations and multiallelic variants in Korean patients with Leber congenital amaurosis.Mol Vis. 2020 Feb 24;26:26-35. eCollection 2020. Mol Vis. 2020. PMID: 32165824 Free PMC article.
-
A Mini-review: Animal Models of GUCY2D Leber Congenital Amaurosis (LCA1).Adv Exp Med Biol. 2016;854:253-8. doi: 10.1007/978-3-319-17121-0_34. Adv Exp Med Biol. 2016. PMID: 26427419 Review.
-
A Mini-Review: Leber Congenital Amaurosis: Identification of Disease-Causing Variants and Personalised Therapies.Adv Exp Med Biol. 2018;1074:265-271. doi: 10.1007/978-3-319-75402-4_32. Adv Exp Med Biol. 2018. PMID: 29721952 Review.
Cited by
-
Photoreceptor function and structure in retinal degenerations caused by biallelic BEST1 mutations.Vision Res. 2023 Feb;203:108157. doi: 10.1016/j.visres.2022.108157. Epub 2022 Nov 28. Vision Res. 2023. PMID: 36450205 Free PMC article.
-
Treatment Potential for Macular Cone Vision in Leber Congenital Amaurosis Due to CEP290 or NPHP5 Mutations: Predictions From Artificial Intelligence.Invest Ophthalmol Vis Sci. 2019 Jun 3;60(7):2551-2562. doi: 10.1167/iovs.19-27156. Invest Ophthalmol Vis Sci. 2019. PMID: 31212307 Free PMC article.
-
Pathways and disease-causing alterations in visual chromophore production for vertebrate vision.J Biol Chem. 2021 Jan-Jun;296:100072. doi: 10.1074/jbc.REV120.014405. Epub 2020 Nov 23. J Biol Chem. 2021. PMID: 33187985 Free PMC article. Review.
-
Retinal response to light exposure in BEST1-mutant dogs evaluated with ultra-high resolution OCT.Vision Res. 2024 May;218:108379. doi: 10.1016/j.visres.2024.108379. Epub 2024 Mar 8. Vision Res. 2024. PMID: 38460402 Free PMC article.
-
Gene regulatory and gene editing tools and their applications for retinal diseases and neuroprotection: From proof-of-concept to clinical trial.Front Neurosci. 2022 Oct 20;16:924917. doi: 10.3389/fnins.2022.924917. eCollection 2022. Front Neurosci. 2022. PMID: 36340792 Free PMC article. Review.
References
-
- Bramall AN, Wright AF, Jacobson SG, McInnes RR. The genomic, biochemical, and cellular responses of the retina in inherited photoreceptor degenerations and prospects for the treatment of these disorders. Annu Rev Neurosci. 2010;33:441–472. - PubMed
-
- Wright AF, Chakarova CF, Abd El-Aziz MM, Bhattacharya SS. Photoreceptor degeneration: genetic and mechanistic dissection of a complex trait. Nat Rev Genet. 2010;11:273–284. - PubMed
-
- Haider NB, Jacobson SG, Cideciyan AV, et al. Mutation of a nuclear receptor gene, NR2E3, causes enhanced S cone syndrome, a disorder of retinal cell fate. Nat Genet. 2000;24:127–131. - PubMed
Publication types
MeSH terms
Substances
LinkOut - more resources
Full Text Sources
Other Literature Sources
Medical
Research Materials
