

A 4-Yr Survey of the Range of Ticks and Tick-Borne Pathogens in the Lehigh Valley Region of Eastern Pennsylvania
- PMID: 31009533
- PMCID: PMC6595528
- DOI: 10.1093/jme/tjz043
A 4-Yr Survey of the Range of Ticks and Tick-Borne Pathogens in the Lehigh Valley Region of Eastern Pennsylvania
Abstract
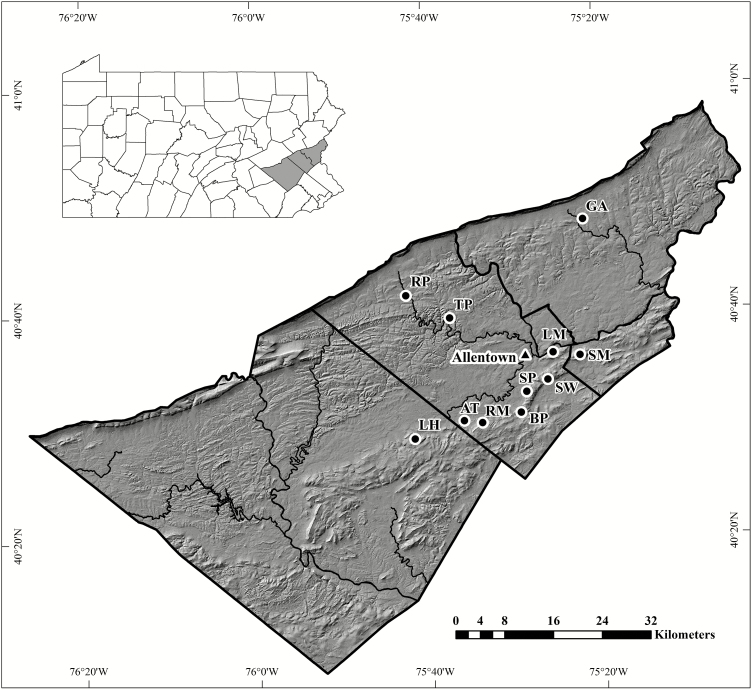
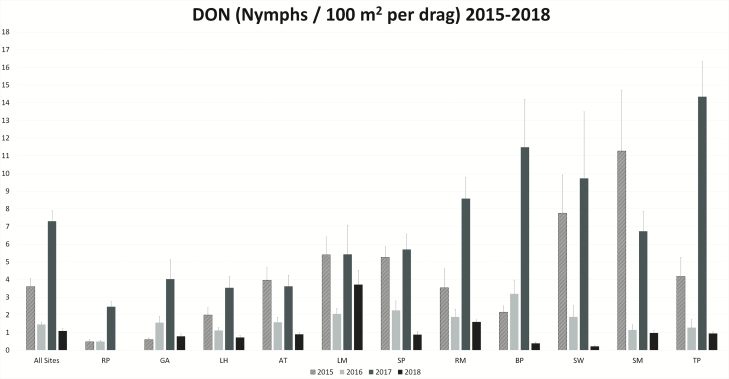
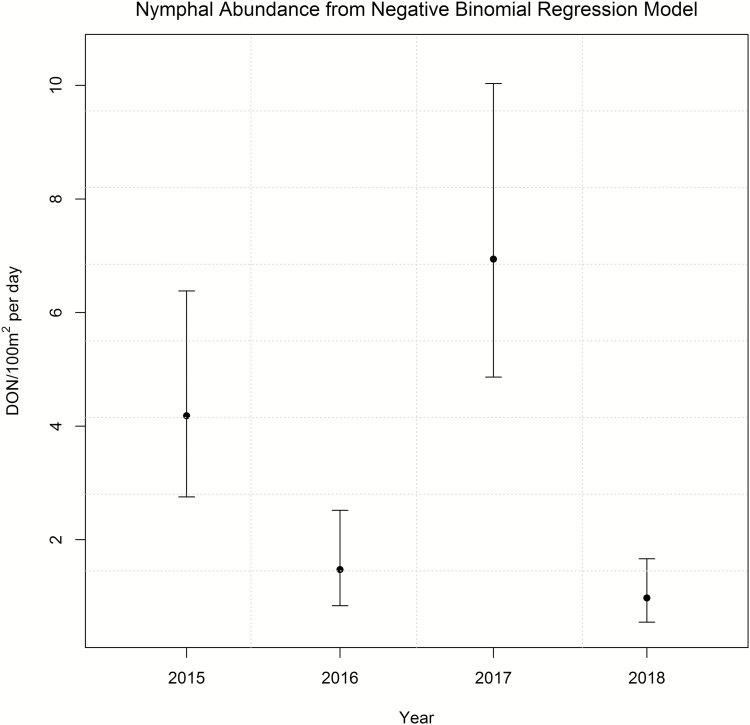
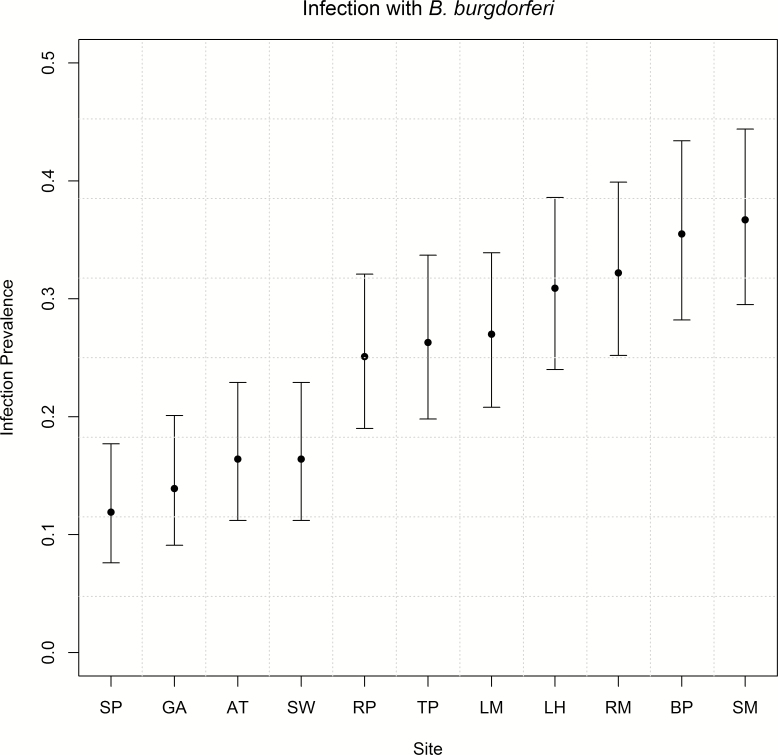
Questing ticks were surveyed by dragging in forested habitats within the Lehigh Valley region of eastern Pennsylvania for four consecutive summers (2015-2018). A high level of inter-annual variation was found in the density of blacklegged tick nymphs, Ixodes scapularis Say, with a high density of host-seeking nymphs (DON) in summer 2015 and 2017 and a relatively low DON in summer 2016 and 2018. Very few American dog ticks (Dermacentor variabilis Say) and Ixodes cookei Packard were collected. Lone star ticks (Amblyomma americanum L.) and longhorned ticks (Haemaphysalis longicornis Neumann) were not represented among the 6,398 ticks collected. For tick-borne pathogen surveillance, DNA samples from 1,721 I. scapularis nymphs were prepared from specimens collected in summers 2015-2017 and screened using qPCR, high resolution melting analysis, and DNA sequencing when necessary. The overall 3-yr nymphal infection prevalence of Borrelia burgdorferi was 24.8%, Borrelia miyamotoi was 0.3%, Anaplasma phagocytophilum variant-ha was 0.8%, and Babesia microti was 2.8%. Prevalence of coinfection with B. burgdorferi and B. microti as well as B. burgdorferi and A. phagocytophilum variant-ha were significantly higher than would be expected by independent infection. B. burgdorferi nymphal infection prevalence is similar to what other studies have found in the Hudson Valley region of New York, but levels of B. microti and A. phagocytophilum variant-ha nymphal infection prevalence are relatively lower. This study reinforces the urgent need for continued tick and pathogen surveillance in the Lehigh Valley region.
Keywords: Lyme disease; anaplasmosis; babesiosis; surveillance; tick.
© The Author(s) 2019. Published by Oxford University Press on behalf of Entomological Society of America.
Figures
Similar articles
-
Tick-Borne Pathogens in Questing Blacklegged Ticks (Acari: Ixodidae) From Pike County, Pennsylvania.J Med Entomol. 2022 Sep 14;59(5):1793-1804. doi: 10.1093/jme/tjac107. J Med Entomol. 2022. PMID: 35920050 Free PMC article.
-
Relatively low prevalence of Babesia microti and Anaplasma phagocytophilum in Ixodes scapularis ticks collected in the Lehigh Valley region of eastern Pennsylvania.Ticks Tick Borne Dis. 2015 Sep;6(6):812-9. doi: 10.1016/j.ttbdis.2015.07.009. Epub 2015 Aug 5. Ticks Tick Borne Dis. 2015. PMID: 26318263
-
Prevalence of Borrelia burgdorferi (Spirochaetales: Spirochaetaceae), Anaplasma phagocytophilum (Rickettsiales: Anaplasmataceae), and Babesia microti (Piroplasmida: Babesiidae) in Ixodes scapularis (Acari: Ixodidae) collected from recreational lands in the Hudson Valley Region, New York State.J Med Entomol. 2014 Jan;51(1):226-36. doi: 10.1603/me13101. J Med Entomol. 2014. PMID: 24605473
-
Prevalence of five human pathogens in host-seeking Ixodes scapularis and Ixodes pacificus by region, state, and county in the contiguous United States generated through national tick surveillance.Ticks Tick Borne Dis. 2023 Nov;14(6):102250. doi: 10.1016/j.ttbdis.2023.102250. Epub 2023 Sep 11. Ticks Tick Borne Dis. 2023. PMID: 37703795 Free PMC article.
-
Prevalence and distribution of seven human pathogens in host-seeking Ixodes scapularis (Acari: Ixodidae) nymphs in Minnesota, USA.Ticks Tick Borne Dis. 2018 Sep;9(6):1499-1507. doi: 10.1016/j.ttbdis.2018.07.009. Epub 2018 Jul 20. Ticks Tick Borne Dis. 2018. PMID: 30055987 Free PMC article.
Cited by
-
Polymicrobial Nature of Tick-Borne Diseases.mBio. 2019 Sep 10;10(5):e02055-19. doi: 10.1128/mBio.02055-19. mBio. 2019. PMID: 31506314 Free PMC article.
-
Sharing the Ride: Ixodes scapularis Symbionts and Their Interactions.Front Cell Infect Microbiol. 2020 Apr 8;10:142. doi: 10.3389/fcimb.2020.00142. eCollection 2020. Front Cell Infect Microbiol. 2020. PMID: 32322563 Free PMC article. Review.
-
A Geographic Information System Approach to Map Tick Exposure Risk at a Scale for Public Health Intervention.J Med Entomol. 2022 Jan 12;59(1):162-172. doi: 10.1093/jme/tjab169. J Med Entomol. 2022. PMID: 34642748 Free PMC article.
-
Tick Densities and Infection Prevalence on Coastal Islands in Massachusetts, USA: Establishing a Baseline.Insects. 2023 Jul 12;14(7):628. doi: 10.3390/insects14070628. Insects. 2023. PMID: 37504634 Free PMC article.
-
Infection rates, species diversity, and distribution of zoonotic Babesia parasites in ticks: a global systematic review and meta-analysis.Parasitol Res. 2022 Jan;121(1):311-334. doi: 10.1007/s00436-021-07359-6. Epub 2021 Nov 9. Parasitol Res. 2022. PMID: 34750651
References
-
- Armstrong P. M., Katavolos P., Caporale D. A., Smith R. P., Spielman A., and Telford S. R. III. 1998. Diversity of Babesia infecting deer ticks (Ixodes dammini). Am. J. Trop. Med. Hyg. 58: 739–742. - PubMed
-
- Ausvet 2019. Calculate confidence limits for a sample proportion. http://epitools.ausvet.com.au/content.php?page=CIProportion
Publication types
MeSH terms
LinkOut - more resources
Full Text Sources
