

Diffuse white matter response in trauma-injured brain to bone marrow stromal cell treatment detected by diffusional kurtosis imaging
- PMID: 31009610
- PMCID: PMC6571170
- DOI: 10.1016/j.brainres.2019.04.020
Diffuse white matter response in trauma-injured brain to bone marrow stromal cell treatment detected by diffusional kurtosis imaging
Abstract
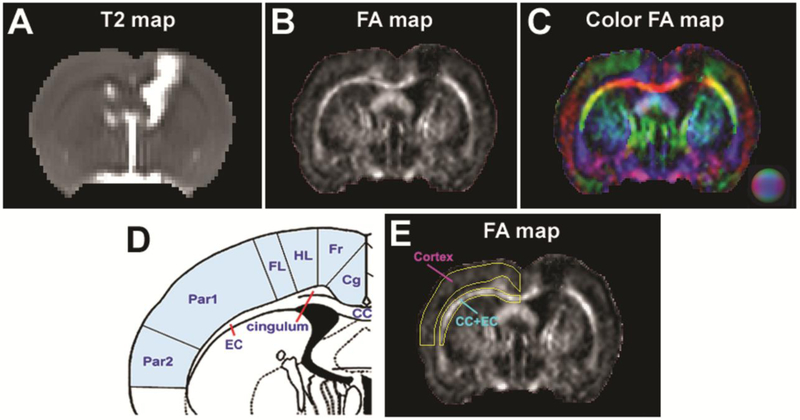
Diffuse white matter (WM) response to traumatic brain injury (TBI) and transplantation of human bone marrow stromal cells (hMSCs) after the injury were non-invasively and dynamically investigated. Male Wistar rats (300-350 g) subjected to TBI were intravenously injected with 1 ml of saline (n = 10) or with hMSCs in suspension (∼3 × 10⁶ hMSCs, n = 10) 1-week post-TBI. MRI measurements of T2-weighted imaging and diffusional kurtosis imaging (DKI) were acquired on all animals at multiple time points up to 3-months post-injury. Functional outcome was assessed using the Morris water maze test. DKI-derived metrics of fractional anisotropy (FA), axonal water fraction (AWF) and radial kurtosis (RK) longitudinally reveal an evolving pattern of structural alteration post-TBI occurring in the brain region remote from primary impact site. The progressive structural change is characterized by gradual disruption of WM integrity at an early stage (weeks post-TBI), followed by spontaneous recovery at a later stage (months post-TBI). Transplantation of hMSCs post-TBI promotes this structural plasticity as indicated by significantly increased FA and AWF in conjunction with substantially elevated RK at the later stage. Our long-term imaging data demonstrate that hMSC therapy leads to modified temporal profiles of these metrics, inducing an earlier presence of enhanced structural remodeling, which may contribute to improved functional recovery.
Keywords: Bone marrow stromal cells; DKI; MRI; Structural change; Traumatic brain injury.
Copyright © 2019 Elsevier B.V. All rights reserved.
Conflict of interest statement
Conflicts of interests
The authors have declared that no conflict of interest exists.
Figures


Similar articles
-
Diffusion-Derived Magnetic Resonance Imaging Measures of Longitudinal Microstructural Remodeling Induced by Marrow Stromal Cell Therapy after Traumatic Brain Injury.J Neurotrauma. 2017 Jan 1;34(1):182-191. doi: 10.1089/neu.2015.4315. Epub 2016 May 13. J Neurotrauma. 2017. PMID: 26993214 Free PMC article.
-
Chronic global analysis of vascular permeability and cerebral blood flow after bone marrow stromal cell treatment of traumatic brain injury in the rat: A long-term MRI study.Brain Res. 2017 Nov 15;1675:61-70. doi: 10.1016/j.brainres.2017.09.007. Epub 2017 Sep 9. Brain Res. 2017. PMID: 28899758 Free PMC article.
-
Effects of treating traumatic brain injury with collagen scaffolds and human bone marrow stromal cells on sprouting of corticospinal tract axons into the denervated side of the spinal cord.J Neurosurg. 2013 Feb;118(2):381-9. doi: 10.3171/2012.11.JNS12753. Epub 2012 Nov 30. J Neurosurg. 2013. PMID: 23198801
-
An Understated Comorbidity: The Impact of Homelessness on Traumatic Brain Injury.Neurotherapeutics. 2023 Oct;20(6):1446-1456. doi: 10.1007/s13311-023-01419-8. Epub 2023 Aug 28. Neurotherapeutics. 2023. PMID: 37639189 Free PMC article. Review.
-
Traumatic brain Injury: Comprehensive overview from pathophysiology to Mesenchymal stem Cell-Based therapies.Int Immunopharmacol. 2025 Jan 27;146:113816. doi: 10.1016/j.intimp.2024.113816. Epub 2024 Dec 20. Int Immunopharmacol. 2025. PMID: 39708488 Review.
Cited by
-
Case Report: An MRI Traumatic Brain Injury Longitudinal Case Study at 7 Tesla: Pre- and Post-injury Structural Network and Volumetric Reorganization and Recovery.Front Neurol. 2021 May 17;12:631330. doi: 10.3389/fneur.2021.631330. eCollection 2021. Front Neurol. 2021. PMID: 34079509 Free PMC article.
-
Stem Cell Therapy for Pediatric Traumatic Brain Injury.Front Neurol. 2020 Dec 2;11:601286. doi: 10.3389/fneur.2020.601286. eCollection 2020. Front Neurol. 2020. PMID: 33343501 Free PMC article. Review.
References
Publication types
MeSH terms
Grants and funding
LinkOut - more resources
Full Text Sources
Medical
